正在加载图片...
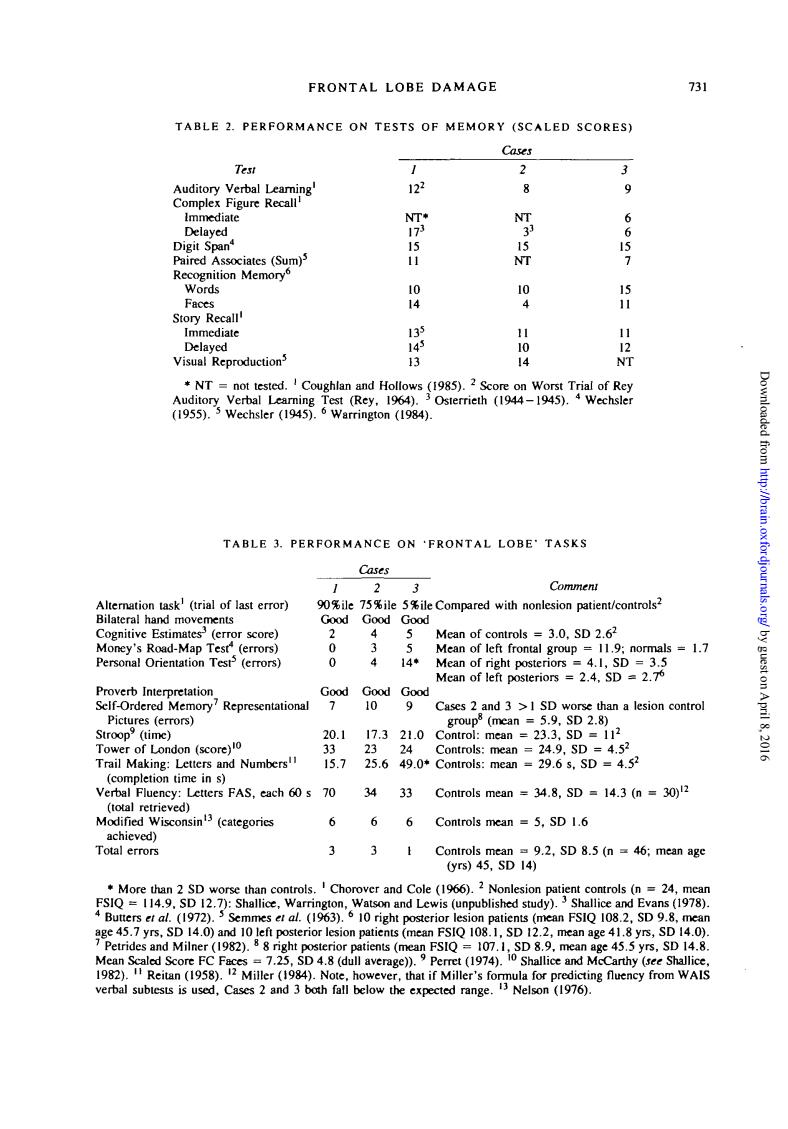
frontal LoBe DAMaGE 立 TABLE 2.PERFORMANCE ON TESTS OF MEMORY (SCALED SCORES) Tes 9 NT ayed aired A on (Sum)s 0 H04 IZM TABLE 3.PERFORMANCE ON FRONTAL LOBE'TASKS 3 Comment =17 Personal Orientation Test(errors) 8 14 =2.4s00_23 onal Cases 2 and 3 >1 SD than a lesion contro s(errors) group (me 20.1 7.321.0C 233 pnil 8.201 ls:m 15.725.649.0*Controis: n二29.6 34 33 Controls mean 34.8,SD 14.3 (n =30)2 6 6 6 Controls mean =5,SD 1.6 3 t Cont 0ys45,sD14 9.2,SD8.5(0=46:mean age M and Cole (1966).2 Nonlesio F0=14.9 and Le 1082,SD9 (1978) 40 10gtpostieriorlesionpatic ts(mean S10108 mean a 98 Scor a7.2 958.2M 8(dull average)). 1974 thy (se FRONTAL LOBE DAMAGE 731 TABLE 2. PERFORMANCE ON TESTS OF MEMORY (SCALED SCORES) Cases Test Auditory Verbal Learning1 Complex Figure Recall1 Immediate Delayed Digit Span4 Paired Associates (Sum)5 Recognition Memory6 Words Faces Story Recall1 Immediate Delayed Visual Reproduction5 / 122 NT* 173 15 11 10 14 135 145 13 2 8 NT 3 3 15 NT 10 4 11 10 14 3 9 6 6 15 7 15 11 11 12 NT • NT = not tested. ' Coughlan and Hollows (1985). 2 Score on Worst Trial of Rey Auditory Verbal Learning Test (Rey, 1964). 3 Osterrieth (1944-1945). 4 Wechsler (1955). 5 Wechsler (1945). 6 Warrington (1984). TABLE 3. PERFORMANCE ON 'FRONTAL LOBE' TASKS Cases Comment Mean of controls = 3.0, SD 2.62 Mean of left frontal group = 11.9; normals = 1.7 Mean of right posteriors = 4.1, SD = 3.5 Mean of left posteriors = 2.4, SD = 2.7* Cases 2 and 3 > 1 SD worse than a lesion control group8 (mean = 5.9, SD 2.8) Control: mean = 23.3, SD = II 2 Controls: mean = 24.9, SD = 4.52 Controls: mean = 29.6 s, SD = 4.52 Controls mean = 34.8, SD = 14.3 (n = 30)12 Controls mean = 5, SD 1.6 Controls mean = 9.2, SD 8.5 (n = 46; mean age (yrs) 45, SD 14) * More than 2 SD worse than controls. ' Chorover and Cole (1966). 2 Nonlesion patient controls (n = 24, mean FSIQ = 114.9, SD 12.7): Shallice, Warrington, Watson and Lewis (unpublished study). 3 Shallice and Evans (1978). 4 Butters et at. (1972). 5 Semmes el al. (1963). 6 10 right posterior lesion patients (mean FSIQ 108.2, SD 9.8, mean age 45.7 yrs, SD 14.0) and 10 left posterior lesion patients (mean FSIQ 108.1, SD 12.2, mean age 41.8 yrs, SD 14.0). 7 Petrides and Milner (1982). 8 8 right posterior patients (mean FSIQ = 107.1, SD 8.9, mean age 45.5 yrs, SD 14.8. Mean Scaled Score FC Faces = 7.25, SD 4.8 (dull average)). 9 Perret (1974). 10 Shallice and McCarthy (see Shallice, 1982). " Reitan (1958). l2 Miller (1984). Note, however, that if Miller's formula for predicting fluency from WAIS verbal subtests is used, Cases 2 and 3 both fall below the expected range. l3 Nelson (1976). Alternation task1 (trial of last error) Bilateral hand movements Cognitive Estimates3 (error score) Money's Road-Map Test4 (errors) Personal Orientation Test5 (errors) Proverb Interpretation Self-Ordered Memory7 Representational Pictures (errors) Stroop9 (time) Tower of London (score)10 Trail Making: Letters and Numbers" (completion time in s) Verbal Fluency: Letters FAS, each 60 s (total retrieved) Modified Wisconsin'3 (categories achieved) Total errors / 90%ile Good 2 0 0 Good 7 20.1 33 15.7 70 6 3 2 75%ile Good 4 3 4 Good 10 17.3 23 25.6 34 6 3 3 5%Ue Good 5 5 14* Good 9 21.0 24 49.0* 33 6 1 by guest on April 8, 2016 http://brain.oxfordjournals.org/ Downloaded from