正在加载图片...
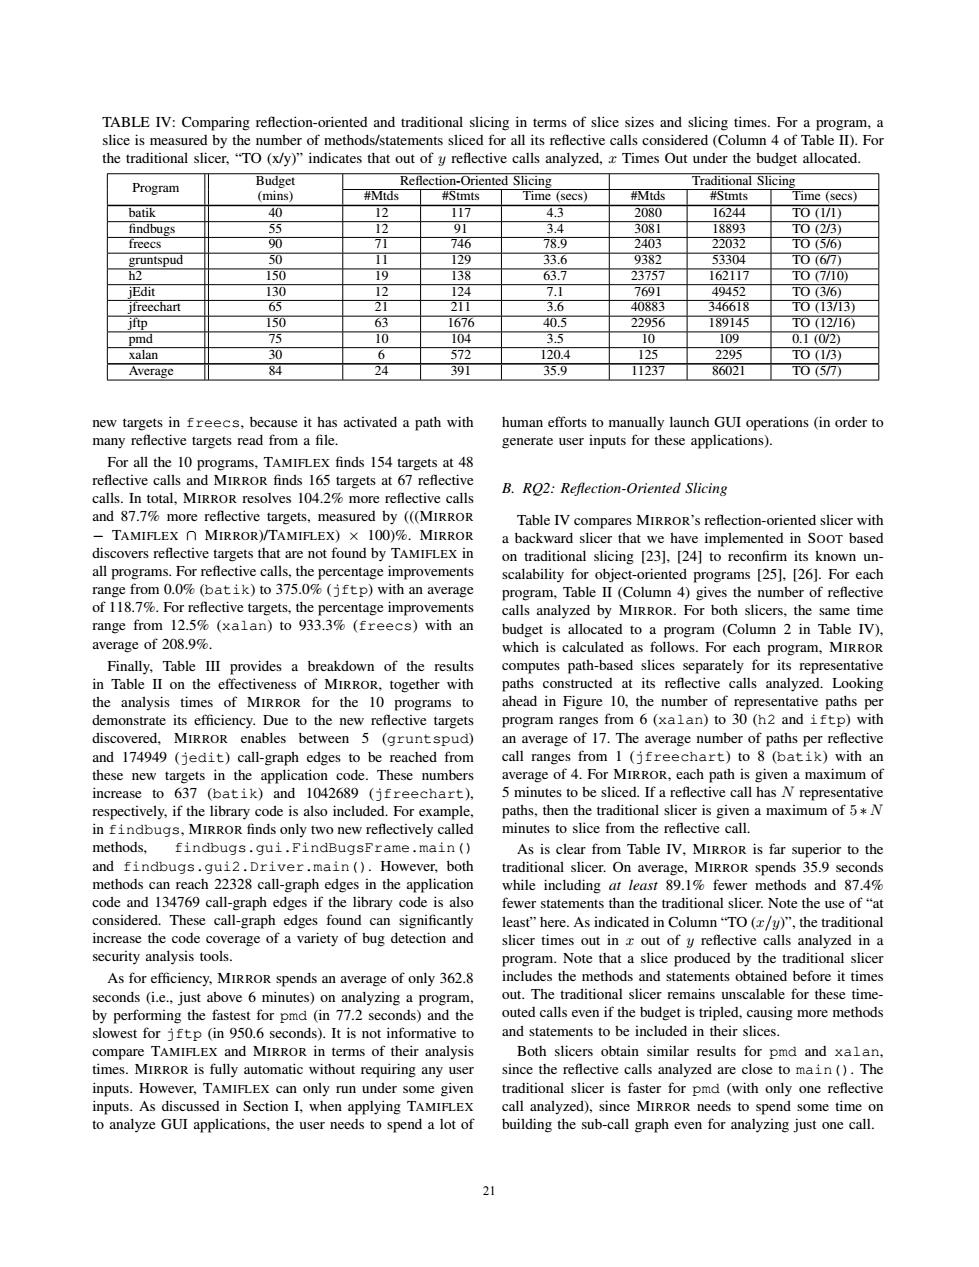
TABLE IV:Comparing reflection-oriented and traditional slicing in terms of slice sizes and slicing times.For a program,a slice is measured by the number of methods/statements sliced for all its reflective calls considered(Column 4 of Table II).For the traditional slicer,"TO(x/y)"indicates that out of y reflective calls analyzed,x Times Out under the budget allocated. Program Budget Reflection-Oriented Slicing Traditional Slicing (mins) #Mtds #Stmts Time(secs)】 #Mtds #Stmts Time (secs) batik 40 12 1I7 4.3 2080 16244 TO (1/1) findbugs 55 12 91 3.4 3081 18893 TO(2/3) freecs 90 71 746 78.9 2403 22032 T0(5/6) gruntspud 50 11 129 33.6 9382 53304 T0(67) h2 150 19 138 63.7 23757 162117 T0(7/10の iEdit 130 12 124 7.1 7691 49452 T03/6) ifreechart 65 21 211T 3.6 40883 346618 TO1313) iftp 150 63 1676 40.5 22956 189145 T0I2I16) pmd 75 10 104 3.5 10 109 0.1(0/2) xalan 30 6 572 120.4 125 2295 T0(1/3) Average 84 24 391T 35.9 1I237 86021 TO(57) new targets in freecs,because it has activated a path with human efforts to manually launch GUI operations (in order to many reflective targets read from a file generate user inputs for these applications). For all the 10 programs,TAMIFLEX finds 154 targets at 48 reflective calls and MIRROR finds 165 targets at 67 reflective B.RO2:Reflection-Oriented Slicing calls.In total,MIRROR resolves 104.2%more reflective calls and 87.7%more reflective targets,measured by (((MIRROR Table IV compares MIRROR's reflection-oriented slicer with -TAMIFLEX n MIRROR)/TAMIFLEX)X 100)%.MIRROR a backward slicer that we have implemented in SooT based discovers reflective targets that are not found by TAMIFLEX in on traditional slicing [23].[24]to reconfirm its known un- all programs.For reflective calls,the percentage improvements scalability for object-oriented programs [25],[26].For each range from 0.0%(batik)to 375.0%(jftp)with an average program,Table II(Column 4)gives the number of reflective of 118.7%.For reflective targets,the percentage improvements calls analyzed by MIRROR.For both slicers,the same time range from 12.5%(xalan)to 933.3%(freecs)with an budget is allocated to a program (Column 2 in Table IV). average of 208.9%. which is calculated as follows.For each program,MIRROR Finally,Table IlI provides a breakdown of the results computes path-based slices separately for its representative in Table II on the effectiveness of MIRROR,together with paths constructed at its reflective calls analyzed.Looking the analysis times of MIRROR for the 10 programs to ahead in Figure 10,the number of representative paths per demonstrate its efficiency.Due to the new reflective targets program ranges from 6(xalan)to 30(h2 and iftp)with discovered,MIRROR enables between 5 (gruntspud) an average of 17.The average number of paths per reflective and 174949 (jedit)call-graph edges to be reached from call ranges from 1 (jfreechart)to 8 (batik)with an these new targets in the application code.These numbers average of 4.For MIRROR,each path is given a maximum of increase to 637 (batik)and 1042689 (jfreechart), 5 minutes to be sliced.If a reflective call has N representative respectively,if the library code is also included.For example, paths,then the traditional slicer is given a maximum of 5*N in findbugs,MIRROR finds only two new reflectively called minutes to slice from the reflective call. methods,findbugs.qui.FindBugsFrame.main ( As is clear from Table IV,MIRROR is far superior to the and findbugs.qui2.Driver.main ()However,both traditional slicer.On average,MIRROR spends 35.9 seconds methods can reach 22328 call-graph edges in the application while including at least 89.1%fewer methods and 87.4% code and 134769 call-graph edges if the library code is also fewer statements than the traditional slicer.Note the use of"at considered.These call-graph edges found can significantly least'”here.As indicated in Column“TO(r/y)”,the traditional increase the code coverage of a variety of bug detection and slicer times out in x out of y reflective calls analyzed in a security analysis tools. program.Note that a slice produced by the traditional slicer As for efficiency,MIRROR spends an average of only 362.8 includes the methods and statements obtained before it times seconds (i.e.,just above 6 minutes)on analyzing a program, out.The traditional slicer remains unscalable for these time- by performing the fastest for pmd (in 77.2 seconds)and the outed calls even if the budget is tripled,causing more methods slowest for jftp (in 950.6 seconds).It is not informative to and statements to be included in their slices. compare TAMIFLEX and MIRROR in terms of their analysis Both slicers obtain similar results for pmd and xalan, times.MIRROR is fully automatic without requiring any user since the reflective calls analyzed are close to main ()The inputs.However,TAMIFLEX can only run under some given traditional slicer is faster for pmd (with only one reflective inputs.As discussed in Section I,when applying TAMIFLEX call analyzed),since MIRROR needs to spend some time on to analyze GUI applications,the user needs to spend a lot of building the sub-call graph even for analyzing just one call. 21TABLE IV: Comparing reflection-oriented and traditional slicing in terms of slice sizes and slicing times. For a program, a slice is measured by the number of methods/statements sliced for all its reflective calls considered (Column 4 of Table II). For the traditional slicer, “TO (x/y)” indicates that out of y reflective calls analyzed, x Times Out under the budget allocated. Program Budget (mins) Reflection-Oriented Slicing Traditional Slicing #Mtds #Stmts Time (secs) #Mtds #Stmts Time (secs) batik 40 12 117 4.3 2080 16244 TO (1/1) findbugs 55 12 91 3.4 3081 18893 TO (2/3) freecs 90 71 746 78.9 2403 22032 TO (5/6) gruntspud 50 11 129 33.6 9382 53304 TO (6/7) h2 150 19 138 63.7 23757 162117 TO (7/10) jEdit 130 12 124 7.1 7691 49452 TO (3/6) jfreechart 65 21 211 3.6 40883 346618 TO (13/13) jftp 150 63 1676 40.5 22956 189145 TO (12/16) pmd 75 10 104 3.5 10 109 0.1 (0/2) xalan 30 6 572 120.4 125 2295 TO (1/3) Average 84 24 391 35.9 11237 86021 TO (5/7) new targets in freecs, because it has activated a path with many reflective targets read from a file. For all the 10 programs, TAMIFLEX finds 154 targets at 48 reflective calls and MIRROR finds 165 targets at 67 reflective calls. In total, MIRROR resolves 104.2% more reflective calls and 87.7% more reflective targets, measured by (((MIRROR − TAMIFLEX ∩ MIRROR)/TAMIFLEX) × 100)%. MIRROR discovers reflective targets that are not found by TAMIFLEX in all programs. For reflective calls, the percentage improvements range from 0.0% (batik) to 375.0% (jftp) with an average of 118.7%. For reflective targets, the percentage improvements range from 12.5% (xalan) to 933.3% (freecs) with an average of 208.9%. Finally, Table III provides a breakdown of the results in Table II on the effectiveness of MIRROR, together with the analysis times of MIRROR for the 10 programs to demonstrate its efficiency. Due to the new reflective targets discovered, MIRROR enables between 5 (gruntspud) and 174949 (jedit) call-graph edges to be reached from these new targets in the application code. These numbers increase to 637 (batik) and 1042689 (jfreechart), respectively, if the library code is also included. For example, in findbugs, MIRROR finds only two new reflectively called methods, findbugs.gui.FindBugsFrame.main() and findbugs.gui2.Driver.main(). However, both methods can reach 22328 call-graph edges in the application code and 134769 call-graph edges if the library code is also considered. These call-graph edges found can significantly increase the code coverage of a variety of bug detection and security analysis tools. As for efficiency, MIRROR spends an average of only 362.8 seconds (i.e., just above 6 minutes) on analyzing a program, by performing the fastest for pmd (in 77.2 seconds) and the slowest for jftp (in 950.6 seconds). It is not informative to compare TAMIFLEX and MIRROR in terms of their analysis times. MIRROR is fully automatic without requiring any user inputs. However, TAMIFLEX can only run under some given inputs. As discussed in Section I, when applying TAMIFLEX to analyze GUI applications, the user needs to spend a lot of human efforts to manually launch GUI operations (in order to generate user inputs for these applications). B. RQ2: Reflection-Oriented Slicing Table IV compares MIRROR’s reflection-oriented slicer with a backward slicer that we have implemented in SOOT based on traditional slicing [23], [24] to reconfirm its known unscalability for object-oriented programs [25], [26]. For each program, Table II (Column 4) gives the number of reflective calls analyzed by MIRROR. For both slicers, the same time budget is allocated to a program (Column 2 in Table IV), which is calculated as follows. For each program, MIRROR computes path-based slices separately for its representative paths constructed at its reflective calls analyzed. Looking ahead in Figure 10, the number of representative paths per program ranges from 6 (xalan) to 30 (h2 and iftp) with an average of 17. The average number of paths per reflective call ranges from 1 (jfreechart) to 8 (batik) with an average of 4. For MIRROR, each path is given a maximum of 5 minutes to be sliced. If a reflective call has N representative paths, then the traditional slicer is given a maximum of 5 ∗ N minutes to slice from the reflective call. As is clear from Table IV, MIRROR is far superior to the traditional slicer. On average, MIRROR spends 35.9 seconds while including at least 89.1% fewer methods and 87.4% fewer statements than the traditional slicer. Note the use of “at least” here. As indicated in Column “TO (x/y)”, the traditional slicer times out in x out of y reflective calls analyzed in a program. Note that a slice produced by the traditional slicer includes the methods and statements obtained before it times out. The traditional slicer remains unscalable for these timeouted calls even if the budget is tripled, causing more methods and statements to be included in their slices. Both slicers obtain similar results for pmd and xalan, since the reflective calls analyzed are close to main(). The traditional slicer is faster for pmd (with only one reflective call analyzed), since MIRROR needs to spend some time on building the sub-call graph even for analyzing just one call. 21