正在加载图片...
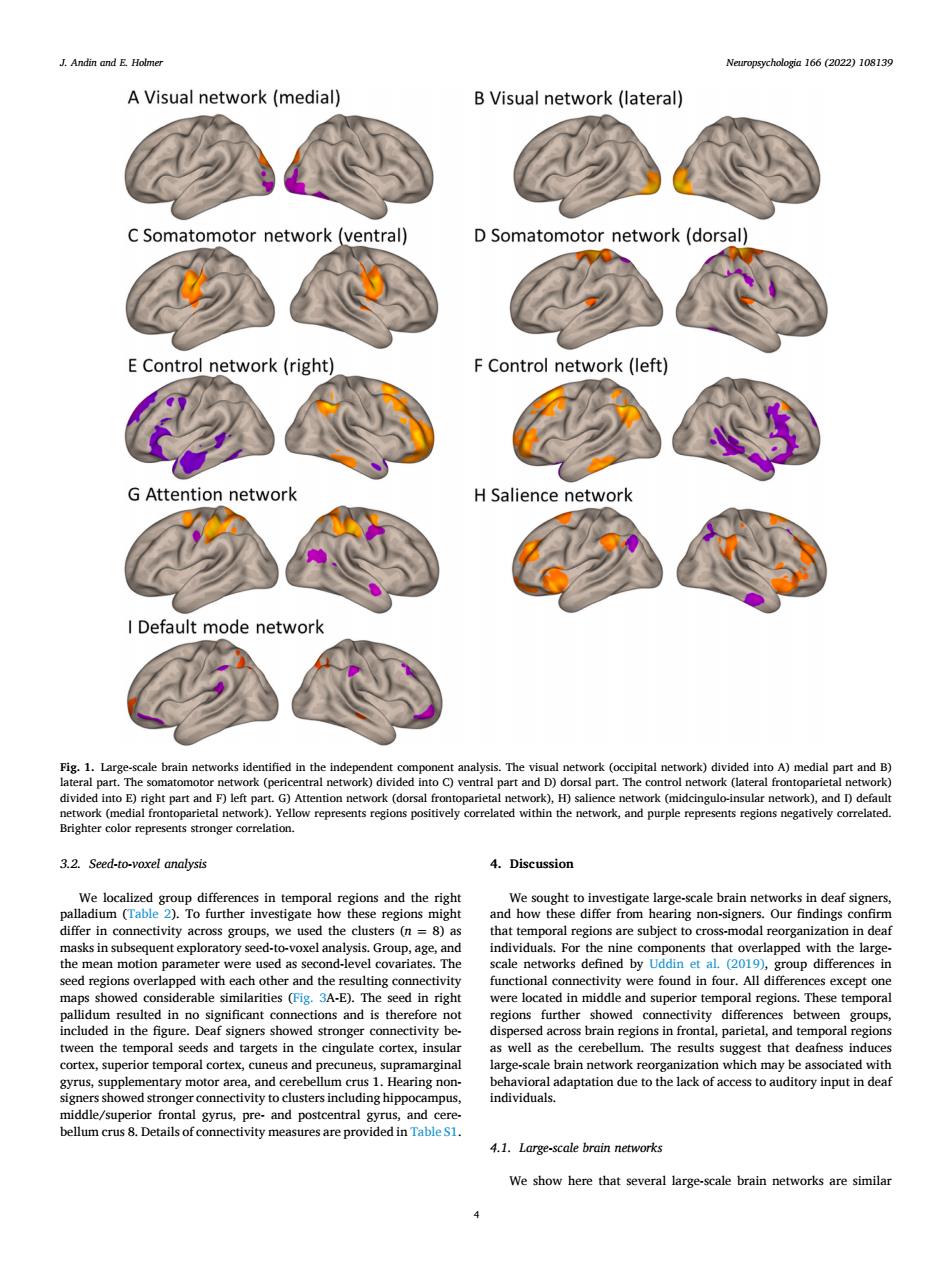
J.Andin and E Holme Neuropsycholegin 166 (2022)108139 A Visual network(medial) B Visual network(lateral) C Somatomotor network(ventral) D Somatomotor network(dorsal) E Control network(right) F Control network(left) G Attention network H Salience network A2 Default mode network ork (occipital network)divided into a)medial part and B ght part and F)e k)di fdo (mi urple repr Brighter color represents stronger correla 3.2.Seed-to-voxel analysi 4.Discussion s in deaf si ers.Our findings onfim analysis.Gr or the nir nts that o pped with the larg ed with each other nd the r found in four.all diffe except on hese tempor d in in the parietal, ior temp corte cun us and prect upram arge ed strong individuals 4.1 arge-scle brain network We show here that several large-cale brain networks are similaNeuropsychologia 166 (2022) 108139 4 3.2. Seed-to-voxel analysis We localized group differences in temporal regions and the right palladium (Table 2). To further investigate how these regions might differ in connectivity across groups, we used the clusters (n = 8) as masks in subsequent exploratory seed-to-voxel analysis. Group, age, and the mean motion parameter were used as second-level covariates. The seed regions overlapped with each other and the resulting connectivity maps showed considerable similarities (Fig. 3A-E). The seed in right pallidum resulted in no significant connections and is therefore not included in the figure. Deaf signers showed stronger connectivity between the temporal seeds and targets in the cingulate cortex, insular cortex, superior temporal cortex, cuneus and precuneus, supramarginal gyrus, supplementary motor area, and cerebellum crus 1. Hearing nonsigners showed stronger connectivity to clusters including hippocampus, middle/superior frontal gyrus, pre- and postcentral gyrus, and cerebellum crus 8. Details of connectivity measures are provided in Table S1. 4. Discussion We sought to investigate large-scale brain networks in deaf signers, and how these differ from hearing non-signers. Our findings confirm that temporal regions are subject to cross-modal reorganization in deaf individuals. For the nine components that overlapped with the largescale networks defined by Uddin et al. (2019), group differences in functional connectivity were found in four. All differences except one were located in middle and superior temporal regions. These temporal regions further showed connectivity differences between groups, dispersed across brain regions in frontal, parietal, and temporal regions as well as the cerebellum. The results suggest that deafness induces large-scale brain network reorganization which may be associated with behavioral adaptation due to the lack of access to auditory input in deaf individuals. 4.1. Large-scale brain networks We show here that several large-scale brain networks are similar Fig. 1. Large-scale brain networks identified in the independent component analysis. The visual network (occipital network) divided into A) medial part and B) lateral part. The somatomotor network (pericentral network) divided into C) ventral part and D) dorsal part. The control network (lateral frontoparietal network) divided into E) right part and F) left part. G) Attention network (dorsal frontoparietal network), H) salience network (midcingulo-insular network), and I) default network (medial frontoparietal network). Yellow represents regions positively correlated within the network, and purple represents regions negatively correlated. Brighter color represents stronger correlation. J. Andin and E. Holmer