正在加载图片...

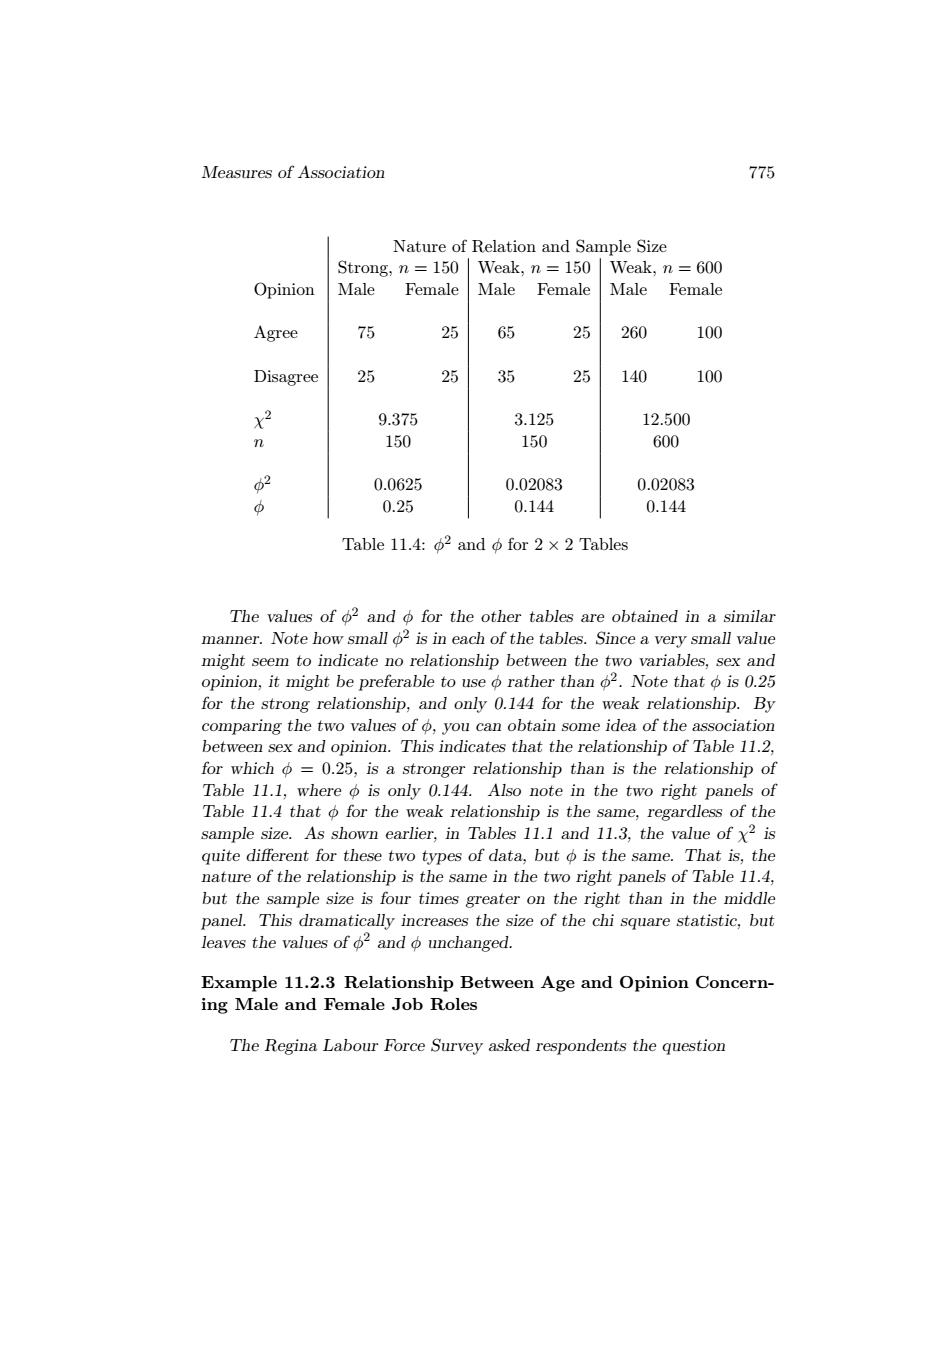
Measures of Association 775 Nature of Relation and Sample Size Strong;n=150 Weak,n=150 Weak.n =600 Opinion Male Female Male Female Male Female Agree 75 25 65 25 260 100 Disagree 25 25 35 25 140 100 x2 9.375 3.125 12.500 n 150 150 600 2 0.0625 0.02083 0.02083 0.25 0.144 0.144 Table 11.4:02 and o for 2 x 2 Tables The values of o2 and o for the other tables are obtained in a similar manner.Note how small o2 is in each of the tables.Since a very small value might seem to indicate no relationship between the two variables,sex and opinion,it might be preferable to use o rather than o2.Note that o is 0.25 for the strong relationship,and only 0.144 for the weak relationship.By comparing the two values of o,you can obtain some idea of the association between sex and opinion.This indicates that the relationship of Table 11.2, for which o =0.25,is a stronger relationship than is the relationship of Table 11.1,where o is only 0.144.Also note in the two right panels of Table 11.4 that o for the weak relationship is the same,regardless of the sample size.As shown earlier,in Tables 11.1 and 11.3,the value of x2 is quite different for these two types of data,but o is the same.That is,the nature of the relationship is the same in the two right panels of Table 11.4, but the sample size is four times greater on the right than in the middle panel.This dramatically increases the size of the chi square statistic,but leaves the values of 2 and o unchanged. Example 11.2.3 Relationship Between Age and Opinion Concern- ing Male and Female Job Roles The Regina Labour Force Survey asked respondents the questionMeasures of Association 775 Nature of Relation and Sample Size Strong, n = 150 Weak, n = 150 Weak, n = 600 Opinion Male Female Male Female Male Female Agree 75 25 65 25 260 100 Disagree 25 25 35 25 140 100 χ 2 9.375 3.125 12.500 n 150 150 600 φ 2 0.0625 0.02083 0.02083 φ 0.25 0.144 0.144 Table 11.4: φ 2 and φ for 2 × 2 Tables The values of φ 2 and φ for the other tables are obtained in a similar manner. Note how small φ 2 is in each of the tables. Since a very small value might seem to indicate no relationship between the two variables, sex and opinion, it might be preferable to use φ rather than φ 2 . Note that φ is 0.25 for the strong relationship, and only 0.144 for the weak relationship. By comparing the two values of φ, you can obtain some idea of the association between sex and opinion. This indicates that the relationship of Table 11.2, for which φ = 0.25, is a stronger relationship than is the relationship of Table 11.1, where φ is only 0.144. Also note in the two right panels of Table 11.4 that φ for the weak relationship is the same, regardless of the sample size. As shown earlier, in Tables 11.1 and 11.3, the value of χ 2 is quite different for these two types of data, but φ is the same. That is, the nature of the relationship is the same in the two right panels of Table 11.4, but the sample size is four times greater on the right than in the middle panel. This dramatically increases the size of the chi square statistic, but leaves the values of φ 2 and φ unchanged. Example 11.2.3 Relationship Between Age and Opinion Concerning Male and Female Job Roles The Regina Labour Force Survey asked respondents the question