正在加载图片...

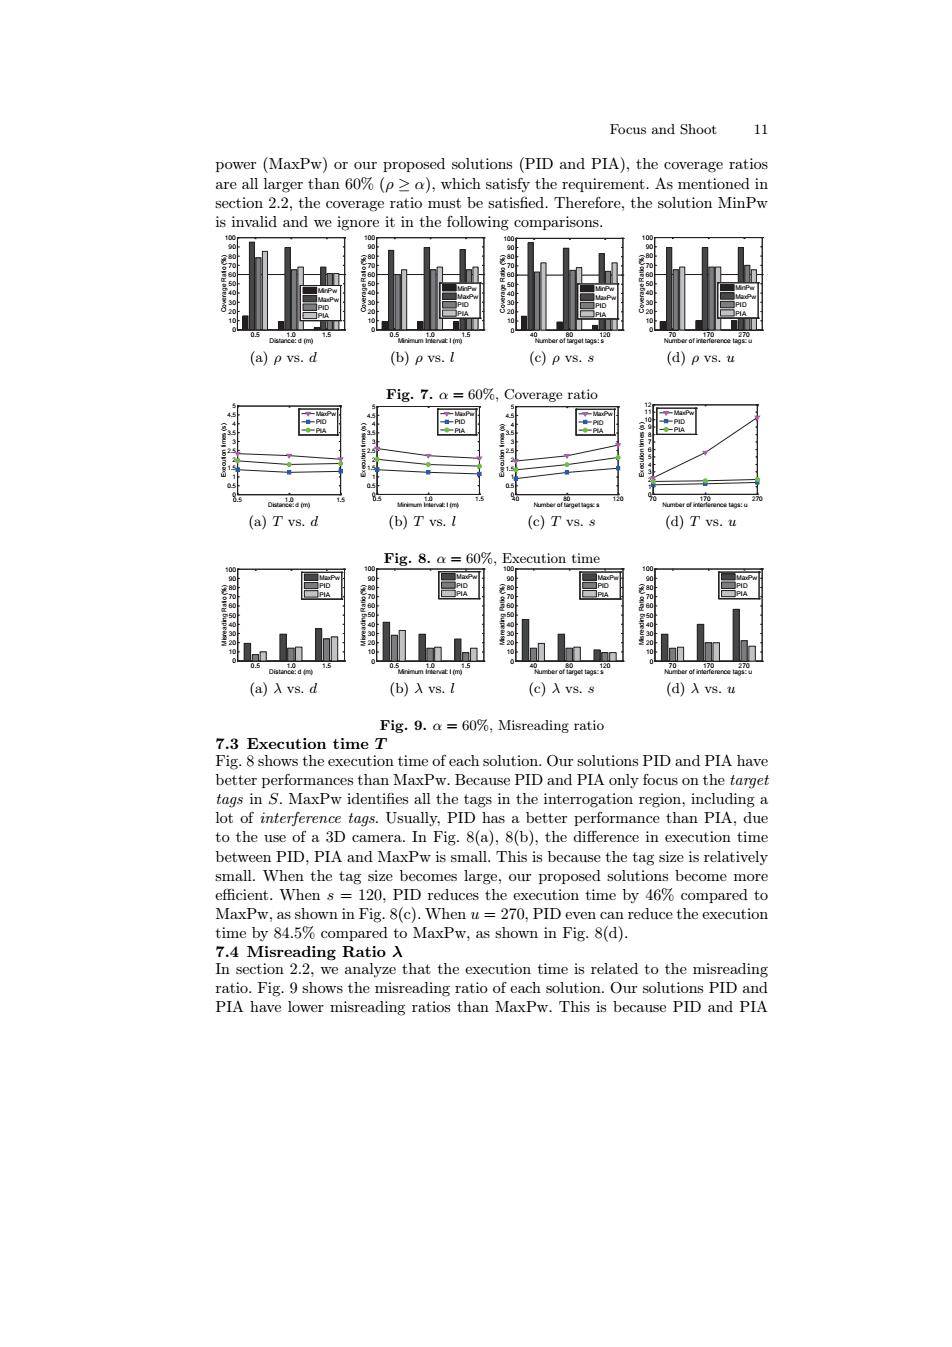
Focus and Shoot 11 power(MaxPw)or our proposed solutions (PID and PIA),the coverage ratios are all larger than 60%(p a),which satisfy the requirement.As mentioned in section 2.2.the coverage ratio must be satisfied.Therefore,the solution MinPw is invalid and we ignore it in the following comparisons. 100 (a)p vs.d (b)p vs. (c)p vs.s (d)p vs.u Fig.7.a 60%,Coverage ratio :d (m) (a)T vs.d (b)T vs.I (c)T vs.s (d)T vs.u Fig.8.a =60%,Execution time 0 (a)λvs.d (b)入vs.l (C)入vs.s (d)入vs.u Fig.9.a 60%,Misreading ratio 7.3 Execution time T Fig.8 shows the execution time of each solution.Our solutions PID and PIA have better performances than MaxPw.Because PID and PIA only focus on the target tags in S.MaxPw identifies all the tags in the interrogation region,including a lot of interference tags.Usually,PID has a better performance than PIA,due to the use of a 3D camera.In Fig.8(a),8(b).the difference in execution time between PID,PIA and MaxPw is small.This is because the tag size is relatively small.When the tag size becomes large,our proposed solutions become more efficient.When s=120,PID reduces the execution time by 46%compared to MaxPw,as shown in Fig.8(c).When u=270,PID even can reduce the execution time by 84.5%compared to MaxPw,as shown in Fig.8(d). 7.4 Misreading Ratio入 In section 2.2,we analyze that the execution time is related to the misreading ratio.Fig.9 shows the misreading ratio of each solution.Our solutions PID and PIA have lower misreading ratios than MaxPw.This is because PID and PIAFocus and Shoot 11 power (MaxPw) or our proposed solutions (PID and PIA), the coverage ratios are all larger than 60% (ρ ≥ α), which satisfy the requirement. As mentioned in section 2.2, the coverage ratio must be satisfied. Therefore, the solution MinPw is invalid and we ignore it in the following comparisons. 0.5 1.0 1.5 0 10 20 30 40 50 60 70 80 90 100 Distance: d (m) Coverage Ratio (%) MinPw MaxPw PID PIA (a) ρ vs. d 0.5 1.0 1.5 0 10 20 30 40 50 60 70 80 90 100 Minimum Interval: l (m) Coverage Ratio (%) MinPw MaxPw PID PIA (b) ρ vs. l 40 80 120 0 10 20 30 40 50 60 70 80 90 100 Number of target tags: s Coverage Ratio (%) MinPw MaxPw PID PIA (c) ρ vs. s 70 170 270 0 10 20 30 40 50 60 70 80 90 100 Number of interference tags: u Coverage Ratio (%) MinPw MaxPw PID PIA (d) ρ vs. u Fig. 7. α = 60%, Coverage ratio 0.5 1.0 1.5 0 0.5 1 1.5 2 2.5 3 3.5 4 4.5 5 Distance: d (m) Execution times (s) MaxPw PID PIA (a) T vs. d 0.5 1.0 1.5 0 0.5 1 1.5 2 2.5 3 3.5 4 4.5 5 Minimum Interval: l (m) Execution times (s) MaxPw PID PIA (b) T vs. l 40 80 120 0 0.5 1 1.5 2 2.5 3 3.5 4 4.5 5 Number of target tags: s Execution times (s) MaxPw PID PIA (c) T vs. s 70 170 270 0 1 2 3 4 5 6 7 8 9 10 11 12 Number of interference tags: u Execution times (s) MaxPw PID PIA (d) T vs. u Fig. 8. α = 60%, Execution time 0.5 1.0 1.5 0 10 20 30 40 50 60 70 80 90 100 Distance: d (m) Misreading Ratio (%) MaxPw PID PIA (a) λ vs. d 0.5 1.0 1.5 0 10 20 30 40 50 60 70 80 90 100 Minimum Interval: l (m) Misreading Ratio (%) MaxPw PID PIA (b) λ vs. l 40 80 120 0 10 20 30 40 50 60 70 80 90 100 Number of target tags: s Misreading Ratio (%) MaxPw PID PIA (c) λ vs. s 70 170 270 0 10 20 30 40 50 60 70 80 90 100 Number of interference tags: u Misreading Ratio (%) MaxPw PID PIA (d) λ vs. u Fig. 9. α = 60%, Misreading ratio 7.3 Execution time T Fig. 8 shows the execution time of each solution. Our solutions PID and PIA have better performances than MaxPw. Because PID and PIA only focus on the target tags in S. MaxPw identifies all the tags in the interrogation region, including a lot of interference tags. Usually, PID has a better performance than PIA, due to the use of a 3D camera. In Fig. 8(a), 8(b), the difference in execution time between PID, PIA and MaxPw is small. This is because the tag size is relatively small. When the tag size becomes large, our proposed solutions become more efficient. When s = 120, PID reduces the execution time by 46% compared to MaxPw, as shown in Fig. 8(c). When u = 270, PID even can reduce the execution time by 84.5% compared to MaxPw, as shown in Fig. 8(d). 7.4 Misreading Ratio λ In section 2.2, we analyze that the execution time is related to the misreading ratio. Fig. 9 shows the misreading ratio of each solution. Our solutions PID and PIA have lower misreading ratios than MaxPw. This is because PID and PIA