正在加载图片...
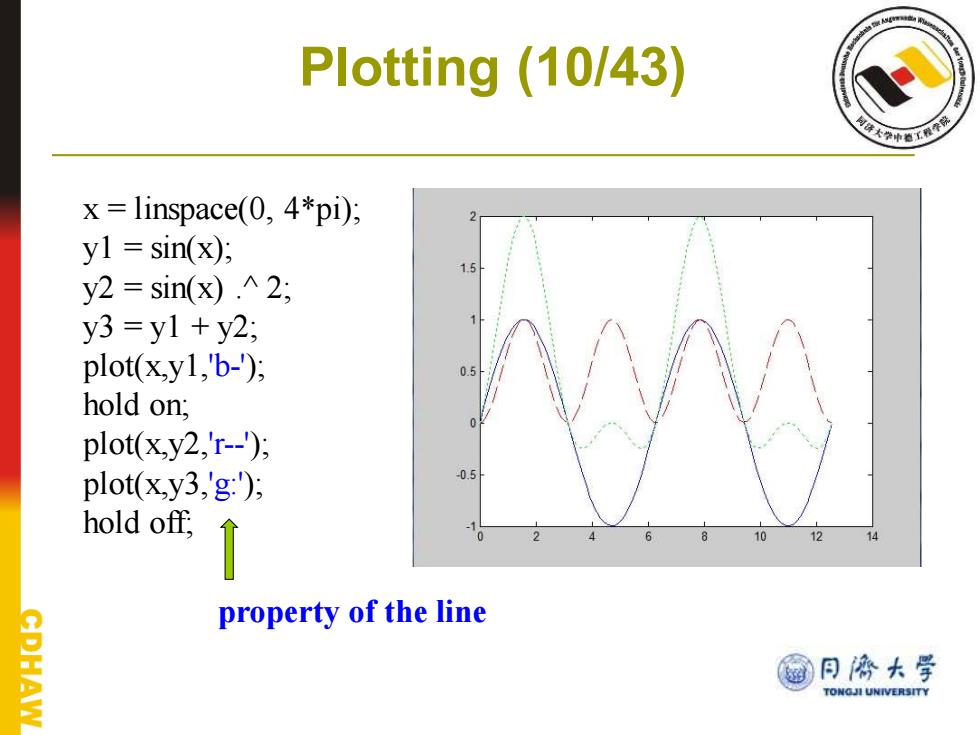
Plotting (10/43) x=linspace(0,4*pi); yl sin(x); y2=sin(x).^2; y3=y1+y2; plot(x,y1,'b-); hold on; plot(x.y2,'r--); plot(x,y3,'g:); hold off, ↑ 12 14 property of the line CDHAW @月协大学 TONGJI UNIVERSITYPlotting (10/43) x = linspace(0, 4*pi); y1 = sin(x); y2 = sin(x) .^ 2; y3 = y1 + y2; plot(x,y1,'b-'); hold on; plot(x,y2,'r--'); plot(x,y3,'g:'); hold off; property of the line