正在加载图片...
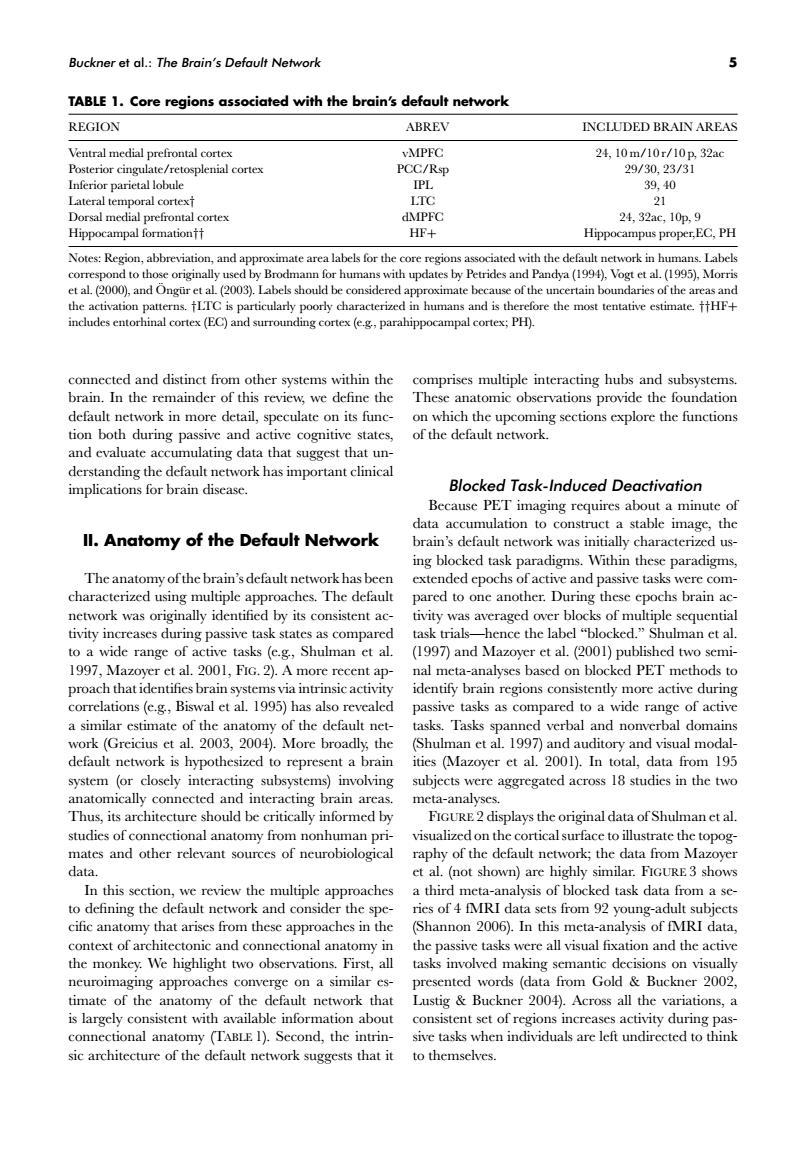
Buckner eta:The Brain's Default Network 5 TABLE 1.Core regions associated with the brain's default network REGION ABREV INCLUDED BRAIN AREAS n( connected and distinct from other systems within the comprises multiple interacting hubs and subsystems brain.In the remainder of this review,we dehne the These anatomic observations provide the foundation default network in more detail,speculate on its func- on which the upcoming sections explore the functions of the default network suggest th ork has important Blocked Task-Induced Deactivation Because PET imaging requires about a minute of ll.Anatomy of the Default Network was The anatomy of the brain's default r characterized using multiple a paches.The defaul network was originally identified by its consistent ac ivity was averaged over blocks of multiple sequential tivity increases during passive task states as compared ask trials ence the label "blocked."Shulman et al. to a wide range of active tasks (e.g,Shulman et al. (1997)and Mazoyer et al.(2001)published two semi- more recent ap- poac中tha n regions co work (Greicius et al.2003,2004).More broadly the Shulman et al 1907)and auditory and visual modal. default network is hypothesized to represent a brain ities(Mazoyer et al.2001).In total,data from 195 system (or closely interacting subsystems)involving subjects were aggregated across 18 studies in the two interacting brain areas meta-analyse should be critically informed by original data ofShulman et al omy fre of n data m)are highly similar.FIGURE3 shov aches a third meta-analysis of blocked task data from a se to defining the default network and consider the spe ries of 4 MRI data sets from 92 young-adult subjects cific anatomy that arises from these approaches in the (Shannon 2006).In this meta-analysis of fMRI data the passive tasks were all visual fixation and the active the monk y.We highlg ht two asks involved approa ork th 004Ac all th is largely consistent with available infor ation abou istent set o广rgi ns in reases activity during connectional anatomy (TABLE 1).Second,the intrin- sive tasks when individuals are left undirected to think sic architecture of the default network suggests that it to themselves.Buckner et al.: The Brain’s Default Network 5 TABLE 1. Core regions associated with the brain’s default network REGION ABREV INCLUDED BRAIN AREAS Ventral medial prefrontal cortex vMPFC 24, 10 m/10 r/10 p, 32ac Posterior cingulate/retosplenial cortex PCC/Rsp 29/30, 23/31 Inferior parietal lobule IPL 39, 40 Lateral temporal cortex† LTC 21 Dorsal medial prefrontal cortex dMPFC 24, 32ac, 10p, 9 Hippocampal formation†† HF+ Hippocampus proper,EC, PH Notes: Region, abbreviation, and approximate area labels for the core regions associated with the default network in humans. Labels correspond to those originally used by Brodmann for humans with updates by Petrides and Pandya (1994), Vogt et al. (1995), Morris et al. (2000), and Ong ¨ ur¨ et al. (2003). Labels should be considered approximate because of the uncertain boundaries of the areas and the activation patterns. †LTC is particularly poorly characterized in humans and is therefore the most tentative estimate. ††HF+ includes entorhinal cortex (EC) and surrounding cortex (e.g., parahippocampal cortex; PH). connected and distinct from other systems within the brain. In the remainder of this review, we define the default network in more detail, speculate on its function both during passive and active cognitive states, and evaluate accumulating data that suggest that understanding the default network has important clinical implications for brain disease. II. Anatomy of the Default Network The anatomy of the brain’s default network has been characterized using multiple approaches. The default network was originally identified by its consistent activity increases during passive task states as compared to a wide range of active tasks (e.g., Shulman et al. 1997, Mazoyer et al. 2001, FIG. 2). A more recent approach that identifies brain systems via intrinsic activity correlations (e.g., Biswal et al. 1995) has also revealed a similar estimate of the anatomy of the default network (Greicius et al. 2003, 2004). More broadly, the default network is hypothesized to represent a brain system (or closely interacting subsystems) involving anatomically connected and interacting brain areas. Thus, its architecture should be critically informed by studies of connectional anatomy from nonhuman primates and other relevant sources of neurobiological data. In this section, we review the multiple approaches to defining the default network and consider the specific anatomy that arises from these approaches in the context of architectonic and connectional anatomy in the monkey. We highlight two observations. First, all neuroimaging approaches converge on a similar estimate of the anatomy of the default network that is largely consistent with available information about connectional anatomy (TABLE 1). Second, the intrinsic architecture of the default network suggests that it comprises multiple interacting hubs and subsystems. These anatomic observations provide the foundation on which the upcoming sections explore the functions of the default network. Blocked Task-Induced Deactivation Because PET imaging requires about a minute of data accumulation to construct a stable image, the brain’s default network was initially characterized using blocked task paradigms. Within these paradigms, extended epochs of active and passive tasks were compared to one another. During these epochs brain activity was averaged over blocks of multiple sequential task trials—hence the label “blocked.” Shulman et al. (1997) and Mazoyer et al. (2001) published two seminal meta-analyses based on blocked PET methods to identify brain regions consistently more active during passive tasks as compared to a wide range of active tasks. Tasks spanned verbal and nonverbal domains (Shulman et al. 1997) and auditory and visual modalities (Mazoyer et al. 2001). In total, data from 195 subjects were aggregated across 18 studies in the two meta-analyses. FIGURE 2 displays the original data of Shulman et al. visualized on the cortical surface to illustrate the topography of the default network; the data from Mazoyer et al. (not shown) are highly similar. FIGURE 3 shows a third meta-analysis of blocked task data from a series of 4 fMRI data sets from 92 young-adult subjects (Shannon 2006). In this meta-analysis of fMRI data, the passive tasks were all visual fixation and the active tasks involved making semantic decisions on visually presented words (data from Gold & Buckner 2002, Lustig & Buckner 2004). Across all the variations, a consistent set of regions increases activity during passive tasks when individuals are left undirected to think to themselves