正在加载图片...
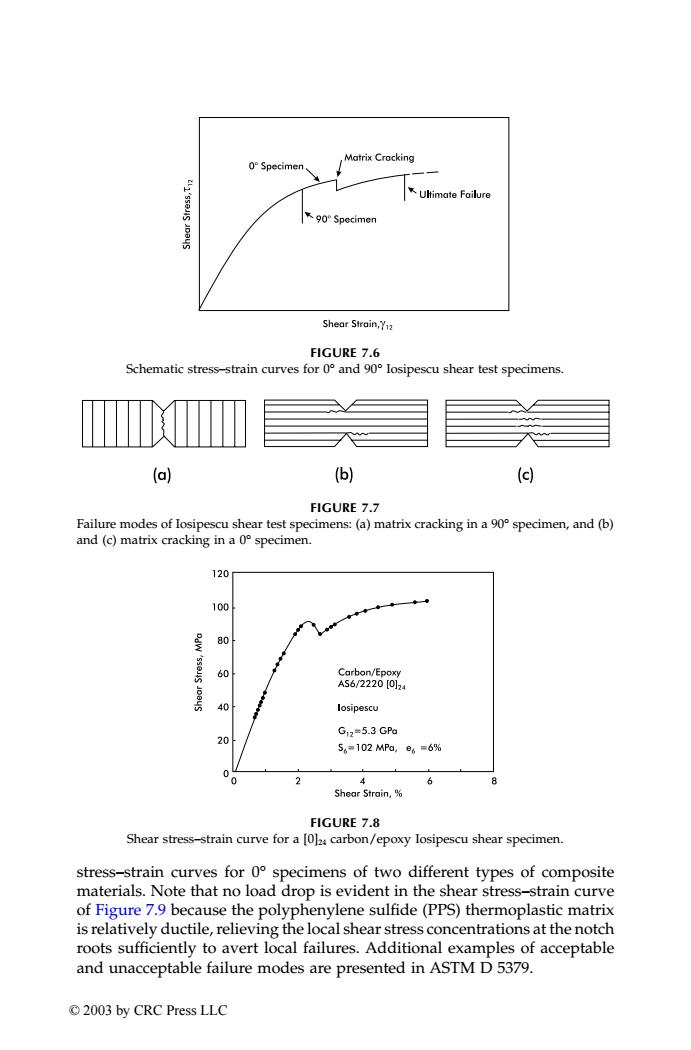
Matrix Cracking O°Specimen Ultimate Failure 下90°Specimen Shear Strain,72 FIGURE 7.6 Schematic stress-strain curves for 0 and 90 losipescu shear test specimens. (a) (b) (c) FIGURE 7.7 Failure modes of losipescu shear test specimens:(a)matrix cracking in a 90 specimen,and(b) and (c)matrix cracking in a 0 specimen. 120 100 80 60 Carbon/Epoxy AS6/2220[0]24 40 losipescu G12=5.3Gfa 20 56=102MPa,e6=6% 0 2 4 6 Shear Strain,% FIGURE 7.8 Shear stress-strain curve for a [0]2 carbon/epoxy losipescu shear specimen. stress-strain curves for 0 specimens of two different types of composite materials.Note that no load drop is evident in the shear stress-strain curve of Figure 7.9 because the polyphenylene sulfide(PPS)thermoplastic matrix is relatively ductile,relieving the local shear stress concentrations at the notch roots sufficiently to avert local failures.Additional examples of acceptable and unacceptable failure modes are presented in ASTM D 5379. ©2003 by CRC Press LLCstress–strain curves for 0° specimens of two different types of composite materials. Note that no load drop is evident in the shear stress–strain curve of Figure 7.9 because the polyphenylene sulfide (PPS) thermoplastic matrix is relatively ductile, relieving the local shear stress concentrations at the notch roots sufficiently to avert local failures. Additional examples of acceptable and unacceptable failure modes are presented in ASTM D 5379. FIGURE 7.6 Schematic stress–strain curves for 0° and 90° Iosipescu shear test specimens. FIGURE 7.7 Failure modes of Iosipescu shear test specimens: (a) matrix cracking in a 90° specimen, and (b) and (c) matrix cracking in a 0° specimen. FIGURE 7.8 Shear stress–strain curve for a [0]24 carbon/epoxy Iosipescu shear specimen. TX001_ch07_Frame Page 110 Saturday, September 21, 2002 4:58 AM © 2003 by CRC Press LLC