正在加载图片...
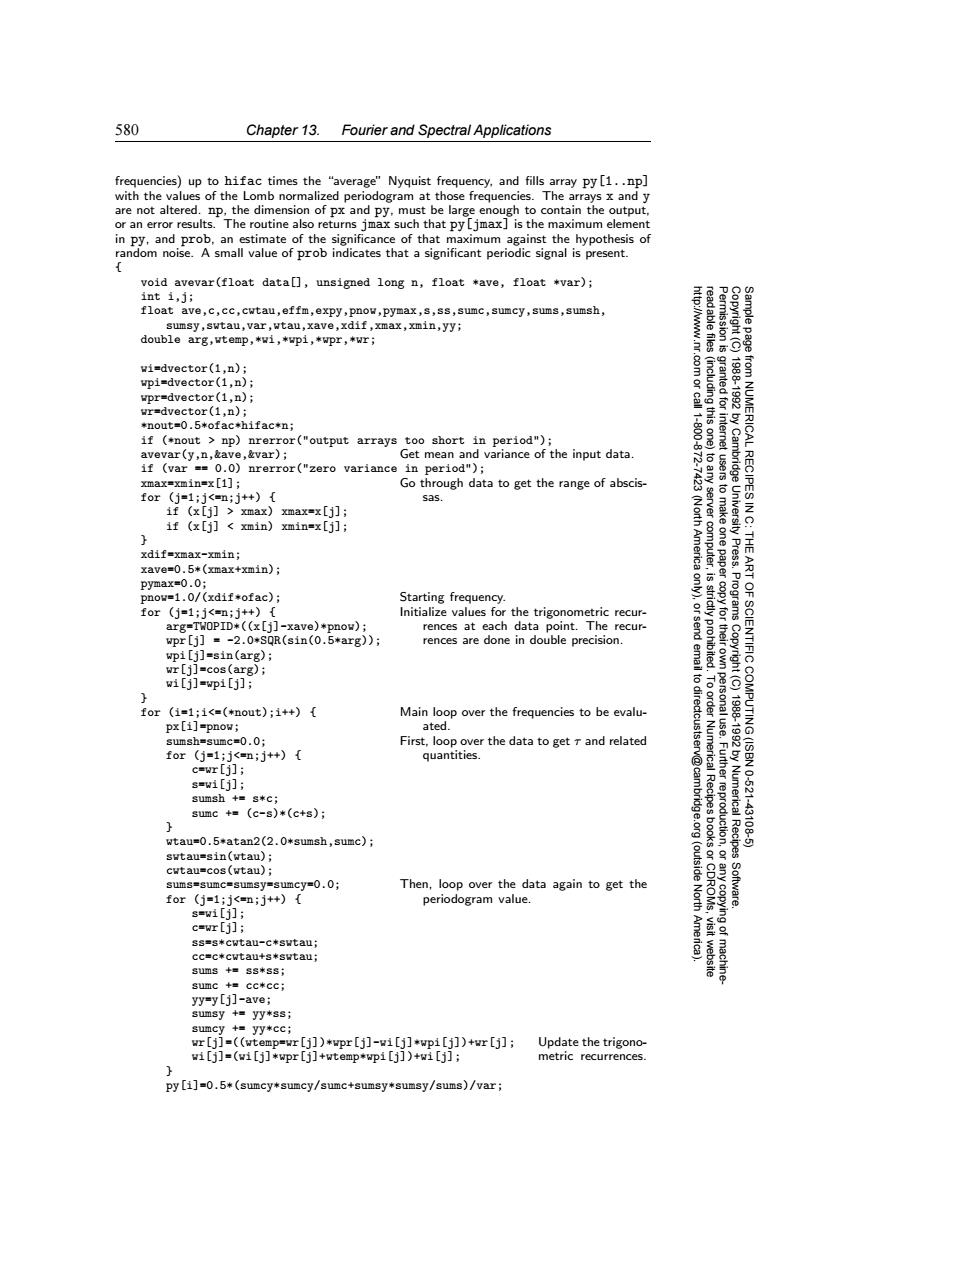
580 Chapter 13. Fourier and Spectral Applications frequencies)up to hifac times the "average"Nyquist frequency,and fills array py [1..np] with the values of the Lomb normalized periodogram at those frequencies.The arrays x and y are not altered.np,the dimension of px and py,must be large enough to contain the output, or an error results. The routine also returns jmax such that py [jmax]is the maximum element in py,and prob,an estimate of the significance of that maximum against the hypothesis of random noise.A small value of prob indicates that a significant periodic signal is present. f void avevar(float data[],unsigned long n,float *ave,float *var); int i,ji float ave,c,cc,cwtau,effm,expy,pnow,pymax,s,ss,sumc,sumcy,sums,sumsh, sumsy,swtau,var,wtau,xave,xdif,xmax,xmin,yy; double arg,wtemp,*wi,*wpi,*wpr,*wr; 常 wi=dvector(1,n); wpi=dvector(1,n); wpr=dvector(1,n): 19881992 wr=dvector(1,n); *nout=0.5*ofac*hifac*n; 1.800 if (*nout np)nrerror("output arrays too short in period")i avevar(y,n,&ave,&var); Get mean and variance of the input data. if (var = 0.0)nrerror("zero variance in period"); Cambridge from NUMERICAL RECIPES I xmax=xmin=x[1]; Go through data to get the range of abscis- for (i=1;i<=n;++) sas. if (x[j]xmax)xmax=x[j]; to make if (x[j]xmin) xmin=x[j]; (Nor 2 xdif=xmax-xmin; America server computer, one paper UnN电.t THE xave=0.5米(xmax+xmin); ART pymax=0.0; pnow=1.0/(xdif*ofac): Starting frequency. for(j=1;j<=n;j++){ Initialize values for the trigonometric recur- Programs arg=TWOPID*((x[j]-xave)*pnow); rences at each data point.The recur- wpr[j]=-2.0*S0R(sin(0.5*arg)); rences are done in double precision. wpi[j]=sin(arg); wr[j]=cos(arg); wi[j]=wpi[j]; to dir for (i=1;i<=(*nout);i++){ Main loop over the frequencies to be evalu- px[i]=pnow; ated. OF SCIENTIFIC COMPUTING(ISBN sumsh=sumc=0.0; First,loop over the data to get and related 18881920 for (j=1;j<=n;j++){ quantities. c=wr[j]; s=w1[j]; 10-621 sumsh+=g来C: sumc +(c-s)*(c+s); .Further reproduction, Numerical Recipes -43108 wtau=0.5*atan2(2.0*sumsh,sumc); swtau=sin(wtau); cwtau=cos(wtau); (outside sums=sumc=sumsy=sumcy=0.0; Then,loop over the data again to get the for (j=1;j<=n;j++){ periodogram value. North Software. s-wi[j]; c=wr[j]; ss=s*cwtau-c*swtau; cc=c*cwtau+s*swtau; sums ss*ss; yy=y[j]-ave; sumsy +yy*ss; sumcy +yy*cc; wr[j]=((wtemp=wr[j])*wpr [j]-wi[j]*wpi[j])+wr[j] Update the trigono- wi[j]=(wi[j]*wpr[j]+wtemp*wpi[j])+wi[j]; metric recurrences. 2 py [i]=0.5*(sumcy*sumcy/sumc+sumsy*sumsy/sums)/var;580 Chapter 13. Fourier and Spectral Applications Permission is granted for internet users to make one paper copy for their own personal use. Further reproduction, or any copyin Copyright (C) 1988-1992 by Cambridge University Press. Programs Copyright (C) 1988-1992 by Numerical Recipes Software. Sample page from NUMERICAL RECIPES IN C: THE ART OF SCIENTIFIC COMPUTING (ISBN 0-521-43108-5) g of machinereadable files (including this one) to any server computer, is strictly prohibited. To order Numerical Recipes books or CDROMs, visit website http://www.nr.com or call 1-800-872-7423 (North America only), or send email to directcustserv@cambridge.org (outside North America). frequencies) up to hifac times the “average” Nyquist frequency, and fills array py[1..np] with the values of the Lomb normalized periodogram at those frequencies. The arrays x and y are not altered. np, the dimension of px and py, must be large enough to contain the output, or an error results. The routine also returns jmax such that py[jmax] is the maximum element in py, and prob, an estimate of the significance of that maximum against the hypothesis of random noise. A small value of prob indicates that a significant periodic signal is present. { void avevar(float data[], unsigned long n, float *ave, float *var); int i,j; float ave,c,cc,cwtau,effm,expy,pnow,pymax,s,ss,sumc,sumcy,sums,sumsh, sumsy,swtau,var,wtau,xave,xdif,xmax,xmin,yy; double arg,wtemp,*wi,*wpi,*wpr,*wr; wi=dvector(1,n); wpi=dvector(1,n); wpr=dvector(1,n); wr=dvector(1,n); *nout=0.5*ofac*hifac*n; if (*nout > np) nrerror("output arrays too short in period"); avevar(y,n,&ave,&var); Get mean and variance of the input data. if (var == 0.0) nrerror("zero variance in period"); xmax=xmin=x[1]; Go through data to get the range of abscisfor (j=1;j<=n;j++) { sas. if (x[j] > xmax) xmax=x[j]; if (x[j] < xmin) xmin=x[j]; } xdif=xmax-xmin; xave=0.5*(xmax+xmin); pymax=0.0; pnow=1.0/(xdif*ofac); Starting frequency. for (j=1;j<=n;j++) { Initialize values for the trigonometric recurrences at each data point. The recurrences are done in double precision. arg=TWOPID*((x[j]-xave)*pnow); wpr[j] = -2.0*SQR(sin(0.5*arg)); wpi[j]=sin(arg); wr[j]=cos(arg); wi[j]=wpi[j]; } for (i=1;i<=(*nout);i++) { Main loop over the frequencies to be evalupx[i]=pnow; ated. sumsh=sumc=0.0; First, loop over the data to get τ and related for (j=1;j<=n;j++) { quantities. c=wr[j]; s=wi[j]; sumsh += s*c; sumc += (c-s)*(c+s); } wtau=0.5*atan2(2.0*sumsh,sumc); swtau=sin(wtau); cwtau=cos(wtau); sums=sumc=sumsy=sumcy=0.0; Then, loop over the data again to get the for (j=1;j<=n;j++) { periodogram value. s=wi[j]; c=wr[j]; ss=s*cwtau-c*swtau; cc=c*cwtau+s*swtau; sums += ss*ss; sumc += cc*cc; yy=y[j]-ave; sumsy += yy*ss; sumcy += yy*cc; wr[j]=((wtemp=wr[j])*wpr[j]-wi[j]*wpi[j])+wr[j]; Update the trigonowi[j]=(wi[j]*wpr[j]+wtemp*wpi[j])+wi[j]; metric recurrences. } py[i]=0.5*(sumcy*sumcy/sumc+sumsy*sumsy/sums)/var;