正在加载图片...
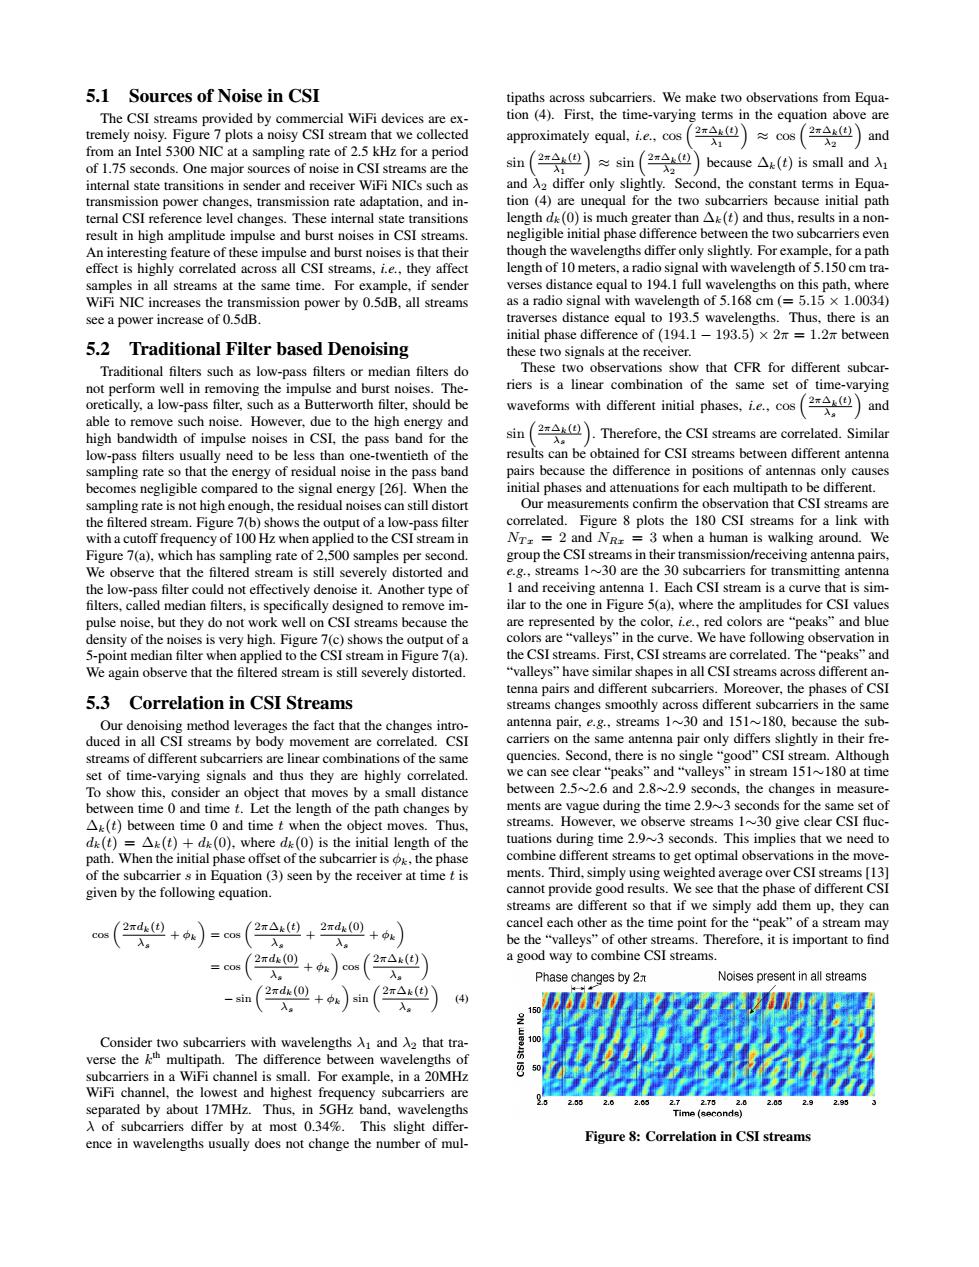
5.1 Sources of Noise in CSI tipaths across subcarriers.We make two observations from Equa- The CSI streams provided by commercial WiFi devices are ex- tion (4).First,the time-varying terms in the equation above are tremely noisy.Figure 7 plots a noisy CSI stream that we collected approximately equal,i.e.,cos 2A@)≈cos(2s但)and A1 入2 from an Intel 5300 NIC at a sampling rate of 2.5 kHz for a period of 1.75 seconds.One major sources of noise in CSI streams are the sin(②mA@)≈sin(2m@)because△k(d)is small and1 入1 入 internal state transitions in sender and receiver WiFi NICs such as and A2 differ only slightly.Second,the constant terms in Equa- transmission power changes,transmission rate adaptation,and in- tion (4)are unequal for the two subcarriers because initial path ternal CSI reference level changes.These internal state transitions length d&(0)is much greater than Ak(t)and thus,results in a non- result in high amplitude impulse and burst noises in CSI streams. negligible initial phase difference between the two subcarriers even An interesting feature of these impulse and burst noises is that their though the wavelengths differ only slightly.For example,for a path effect is highly correlated across all CSI streams,i.e.,they affect length of 10 meters.a radio signal with wavelength of 5.150 cm tra- samples in all streams at the same time.For example,if sender verses distance equal to 194.1 full wavelengths on this path,where WiFi NIC increases the transmission power by 0.5dB,all streams as a radio signal with wavelength of 5.168 cm (5.15 x 1.0034) see a power increase of 0.5dB. traverses distance equal to 193.5 wavelengths.Thus,there is an initial phase difference of(194.1-193.5)x 2=1.2m between 5.2 Traditional Filter based Denoising these two signals at the receiver. Traditional filters such as low-pass filters or median filters do These two observations show that CFR for different subcar- not perform well in removing the impulse and burst noises.The- riers is a linear combination of the same set of time-varying oretically,a low-pass filter,such as a Butterworth filter,should be waveforms with different initial phases,i.e.,cos and 入 able to remove such noise.However,due to the high energy and high bandwidth of impulse noises in CSI,the pass band for the sin (Therefore,the CSI streams are correlated.Similar A low-pass filters usually need to be less than one-twentieth of the results can be obtained for CSI streams between different antenna sampling rate so that the energy of residual noise in the pass band pairs because the difference in positions of antennas only causes becomes negligible compared to the signal energy [26].When the initial phases and attenuations for each multipath to be different sampling rate is not high enough,the residual noises can still distort Our measurements confirm the observation that CSI streams are the filtered stream.Figure 7(b)shows the output of a low-pass filter correlated.Figure 8 plots the 180 CSI streams for a link with with a cutoff frequency of 100 Hz when applied to the CSI stream in Nr=2 and Nr=3 when a human is walking around.We Figure 7(a),which has sampling rate of 2,500 samples per second. group the CSI streams in their transmission/receiving antenna pairs, We observe that the filtered stream is still severely distorted and e.g.,streams 1~30 are the 30 subcarriers for transmitting antenna the low-pass filter could not effectively denoise it.Another type of 1 and receiving antenna 1.Each CSI stream is a curve that is sim- filters,called median filters,is specifically designed to remove im- ilar to the one in Figure 5(a),where the amplitudes for CSI values pulse noise,but they do not work well on CSI streams because the are represented by the color,i.e.,red colors are "peaks"and blue density of the noises is very high.Figure 7(c)shows the output of a colors are "valleys"in the curve.We have following observation in 5-point median filter when applied to the CSI stream in Figure 7(a) the CSI streams.First.CSI streams are correlated.The"peaks"and We again observe that the filtered stream is still severely distorted. "valleys"have similar shapes in all CSI streams across different an- tenna pairs and different subcarriers.Moreover,the phases of CSI 5.3 Correlation in CSI Streams streams changes smoothly across different subcarriers in the same Our denoising method leverages the fact that the changes intro- antenna pair,e.g.,streams 1~30 and 151~180.because the sub- duced in all CSI streams by body movement are correlated.CSI carriers on the same antenna pair only differs slightly in their fre- streams of different subcarriers are linear combinations of the same quencies.Second,there is no single "good"CSI stream.Although set of time-varying signals and thus they are highly correlated. we can see clear"peaks"and "valleys"in stream 151~180 at time To show this,consider an object that moves by a small distance between 2.5~2.6 and 2.8~2.9 seconds,the changes in measure between time 0 and time t.Let the length of the path changes by ments are vague during the time 2.9~3 seconds for the same set of A(t)between time 0 and time t when the object moves.Thus. streams.However,we observe streams 1~30 give clear CSI fluc- dk(t)=Ak(t)+dk(0),where d(0)is the initial length of the tuations during time 2.9~3 seconds.This implies that we need to path.When the initial phase offset of the subcarrier is,the phase combine different streams to get optimal observations in the move- of the subcarrier s in Equation (3)seen by the receiver at time t is ments.Third,simply using weighted average over CSI streams [13] given by the following equation. cannot provide good results.We see that the phase of different CSl streams are different so that if we simply add them up.they can s(24但+)=os(2mA但+2d0+)) cancel each other as the time point for the "peak"of a stream may 入。 入。 be the "valleys"of other streams.Therefore.it is important to find a good way to combine CSI streams. cos (2d0+)os(2mA@ 、入 Phase changes by 2 Noises present in all streams -sim(240+)in(2@ (4) 入。 Consider two subcarriers with wavelengths A1 and A2 that tra- verse the k multipath.The difference between wavelengths of subcarriers in a WiFi channel is small.For example,in a 20MHz WiFi channel.the lowest and highest frequency subcarriers are separated by about 17MHz.Thus,in 5GHz band,wavelengths Time (seconds) A of subcarriers differ by at most 0.34%.This slight differ- ence in wavelengths usually does not change the number of mul- Figure 8:Correlation in CSI streams5.1 Sources of Noise in CSI The CSI streams provided by commercial WiFi devices are extremely noisy. Figure 7 plots a noisy CSI stream that we collected from an Intel 5300 NIC at a sampling rate of 2.5 kHz for a period of 1.75 seconds. One major sources of noise in CSI streams are the internal state transitions in sender and receiver WiFi NICs such as transmission power changes, transmission rate adaptation, and internal CSI reference level changes. These internal state transitions result in high amplitude impulse and burst noises in CSI streams. An interesting feature of these impulse and burst noises is that their effect is highly correlated across all CSI streams, i.e., they affect samples in all streams at the same time. For example, if sender WiFi NIC increases the transmission power by 0.5dB, all streams see a power increase of 0.5dB. 5.2 Traditional Filter based Denoising Traditional filters such as low-pass filters or median filters do not perform well in removing the impulse and burst noises. Theoretically, a low-pass filter, such as a Butterworth filter, should be able to remove such noise. However, due to the high energy and high bandwidth of impulse noises in CSI, the pass band for the low-pass filters usually need to be less than one-twentieth of the sampling rate so that the energy of residual noise in the pass band becomes negligible compared to the signal energy [26]. When the sampling rate is not high enough, the residual noises can still distort the filtered stream. Figure 7(b) shows the output of a low-pass filter with a cutoff frequency of 100 Hz when applied to the CSI stream in Figure 7(a), which has sampling rate of 2,500 samples per second. We observe that the filtered stream is still severely distorted and the low-pass filter could not effectively denoise it. Another type of filters, called median filters, is specifically designed to remove impulse noise, but they do not work well on CSI streams because the density of the noises is very high. Figure 7(c) shows the output of a 5-point median filter when applied to the CSI stream in Figure 7(a). We again observe that the filtered stream is still severely distorted. 5.3 Correlation in CSI Streams Our denoising method leverages the fact that the changes introduced in all CSI streams by body movement are correlated. CSI streams of different subcarriers are linear combinations of the same set of time-varying signals and thus they are highly correlated. To show this, consider an object that moves by a small distance between time 0 and time t. Let the length of the path changes by ∆k(t) between time 0 and time t when the object moves. Thus, dk(t) = ∆k(t) + dk(0), where dk(0) is the initial length of the path. When the initial phase offset of the subcarrier is φk, the phase of the subcarrier s in Equation (3) seen by the receiver at time t is given by the following equation. cos 2πdk(t) λs + φk = cos 2π∆k(t) λs + 2πdk(0) λs + φk = cos 2πdk(0) λs + φk cos 2π∆k(t) λs − sin 2πdk(0) λs + φk sin 2π∆k(t) λs (4) Consider two subcarriers with wavelengths λ1 and λ2 that traverse the k th multipath. The difference between wavelengths of subcarriers in a WiFi channel is small. For example, in a 20MHz WiFi channel, the lowest and highest frequency subcarriers are separated by about 17MHz. Thus, in 5GHz band, wavelengths λ of subcarriers differ by at most 0.34%. This slight difference in wavelengths usually does not change the number of multipaths across subcarriers. We make two observations from Equation (4). First, the time-varying terms in the equation above are approximately equal, i.e., cos 2π∆k(t) λ1 ≈ cos 2π∆k(t) λ2 and sin 2π∆k(t) λ1 ≈ sin 2π∆k(t) λ2 because ∆k(t) is small and λ1 and λ2 differ only slightly. Second, the constant terms in Equation (4) are unequal for the two subcarriers because initial path length dk(0) is much greater than ∆k(t) and thus, results in a nonnegligible initial phase difference between the two subcarriers even though the wavelengths differ only slightly. For example, for a path length of 10 meters, a radio signal with wavelength of 5.150 cm traverses distance equal to 194.1 full wavelengths on this path, where as a radio signal with wavelength of 5.168 cm (= 5.15 × 1.0034) traverses distance equal to 193.5 wavelengths. Thus, there is an initial phase difference of (194.1 − 193.5) × 2π = 1.2π between these two signals at the receiver. These two observations show that CFR for different subcarriers is a linear combination of the same set of time-varying waveforms with different initial phases, i.e., cos 2π∆k(t) λs and sin 2π∆k(t) λs . Therefore, the CSI streams are correlated. Similar results can be obtained for CSI streams between different antenna pairs because the difference in positions of antennas only causes initial phases and attenuations for each multipath to be different. Our measurements confirm the observation that CSI streams are correlated. Figure 8 plots the 180 CSI streams for a link with NT x = 2 and NRx = 3 when a human is walking around. We group the CSI streams in their transmission/receiving antenna pairs, e.g., streams 1∼30 are the 30 subcarriers for transmitting antenna 1 and receiving antenna 1. Each CSI stream is a curve that is similar to the one in Figure 5(a), where the amplitudes for CSI values are represented by the color, i.e., red colors are “peaks” and blue colors are “valleys” in the curve. We have following observation in the CSI streams. First, CSI streams are correlated. The “peaks” and “valleys” have similar shapes in all CSI streams across different antenna pairs and different subcarriers. Moreover, the phases of CSI streams changes smoothly across different subcarriers in the same antenna pair, e.g., streams 1∼30 and 151∼180, because the subcarriers on the same antenna pair only differs slightly in their frequencies. Second, there is no single “good” CSI stream. Although we can see clear “peaks” and “valleys” in stream 151∼180 at time between 2.5∼2.6 and 2.8∼2.9 seconds, the changes in measurements are vague during the time 2.9∼3 seconds for the same set of streams. However, we observe streams 1∼30 give clear CSI fluctuations during time 2.9∼3 seconds. This implies that we need to combine different streams to get optimal observations in the movements. Third, simply using weighted average over CSI streams [13] cannot provide good results. We see that the phase of different CSI streams are different so that if we simply add them up, they can cancel each other as the time point for the “peak” of a stream may be the “valleys” of other streams. Therefore, it is important to find a good way to combine CSI streams. Figure 8: Correlation in CSI streams