正在加载图片...

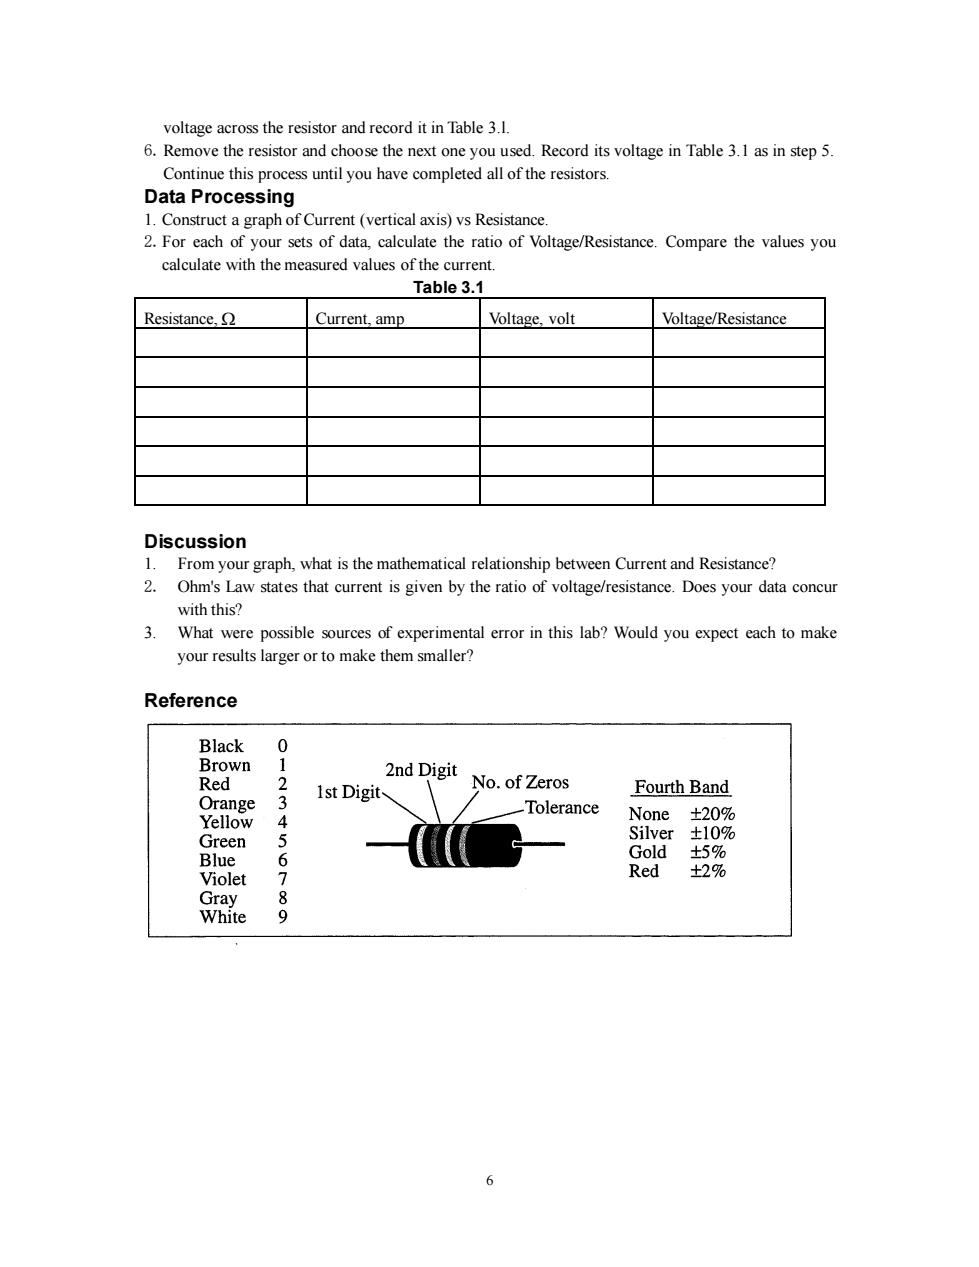
voltage across the resistor and record it in Table 3.1. 6.Remove the resistor and choose the next one you used.Record its voltage in Table 3.1 as in step 5. Continue this process until you have completed all of the resistors. Data Processing 1.Construct a graph of Current(vertical axis)vs Resistance. 2.For each of your sets of data,calculate the ratio of Voltage/Resistance.Compare the values you calculate with the measured values of the current. Table 3.1 Resistance. Current.amp Voltage,volt Voltage/Resistance Discussion 1.From your graph,what is the mathematical relationship between Current and Resistance? 2.Ohm's Law states that current is given by the ratio of voltage/resistance.Does your data concur with this? 3.What were possible sources of experimental error in this lab?Would you expect each to make your results larger or to make them smaller? Reference Black 0 Brown 1 2nd Digit Red 1st Digit No.of Zeros Fourth Band Orange 3 Tolerance Yellow 4 None±20% Green 5 Silver±10% Blue 6 Gold ±5% Violet Red ±2% Gray 8 White 9 66 voltage across the resistor and record it in Table 3.l. 6.Remove the resistor and choose the next one you used. Record its voltage in Table 3.1 as in step 5. Continue this process until you have completed all of the resistors. Data Processing 1. Construct a graph of Current (vertical axis) vs Resistance. 2.For each of your sets of data, calculate the ratio of Voltage/Resistance. Compare the values you calculate with the measured values of the current. Table 3.1 Resistance, Current, amp Voltage, volt Voltage/Resistance Discussion 1. From your graph, what is the mathematical relationship between Current and Resistance? 2. Ohm's Law states that current is given by the ratio of voltage/resistance. Does your data concur with this? 3. What were possible sources of experimental error in this lab? Would you expect each to make your results larger or to make them smaller? Reference