正在加载图片...

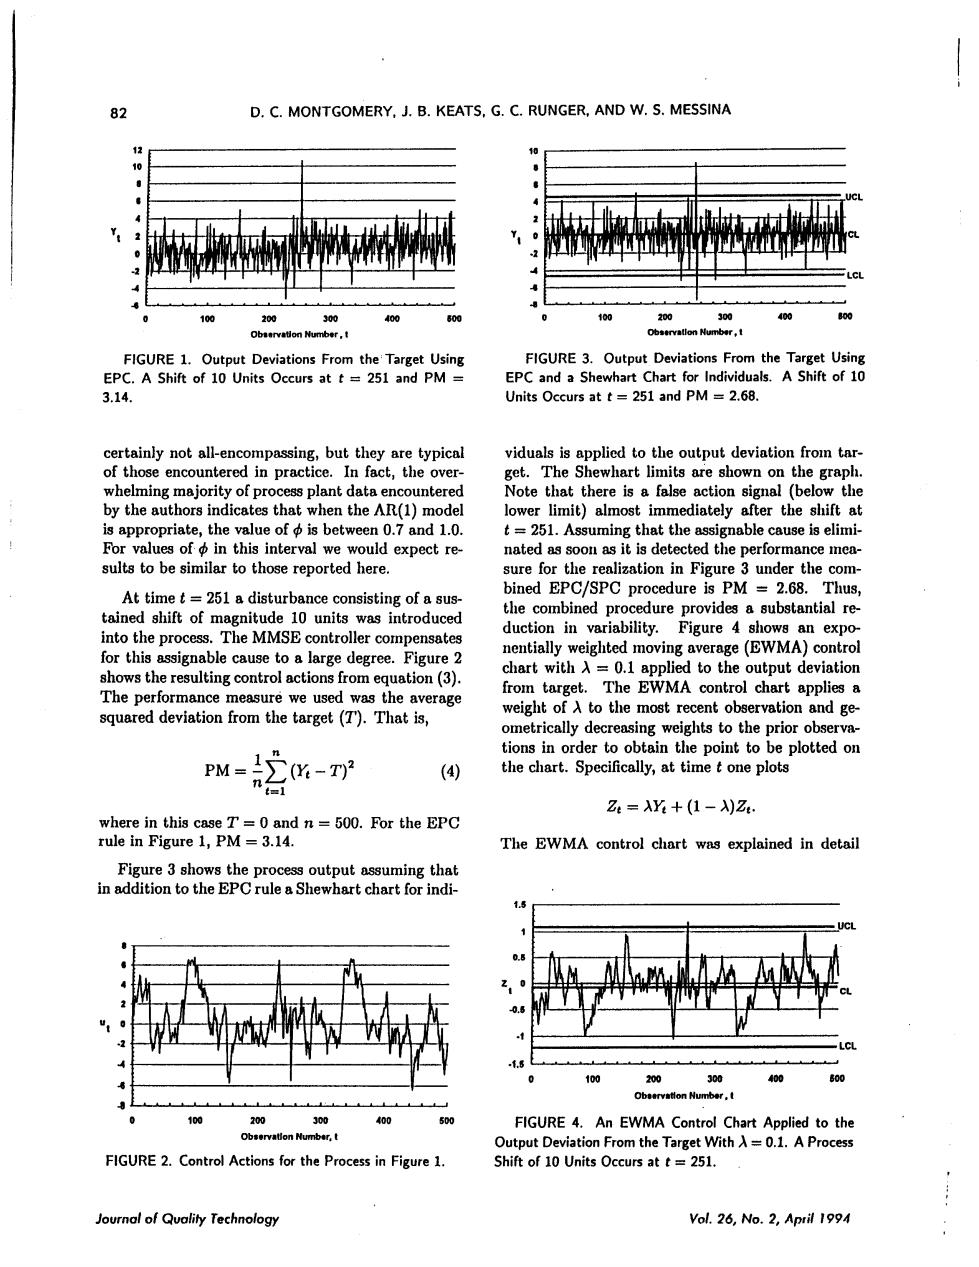
82 D.C.MONTGOMERY,J.B.KEATS,G.C.RUNGER,AND W.S.MESSINA 4出 the FIGURE 3.Outpu Deviations from the Tar 3.14 Units Occurs at t=251 and PM =2.68. certainly not all-encompassing.but they are typical of those encountered in practice.In fact,the over- untered et te2oao的aa viduals is applied to the output deviation from tar d1.0. that the For values of in this interval we would expect re- nated as soon as it is detected the performance men sults to be similar to those reported here. sure for the realization in Figure 3 under the com- bined EPC/SPC procedure is PM=2.6 shift of ne ure prov ntial re The MMSE C ecomb (EWMA) trol chart with A=0.1 ap plied to the output deviation shows the resulting control actions from eauation (3) The performance measure we used was the average from target.The EWMA control chart applies a most recent obe squared deviation from the target (T).That is, weight of A to the rvation and ge metrically decr prior obs ut to plottedon (4) Z4=AY+(1-)Z. The EWMA control chart was explained in detai 4 ta. FIGURE 4.An EWMA Control Chart Applied on N FIGURE 2.Control Actions for the Process in Figure 1 Shift of 10 Units Occurs at t=251 of Qvality Technolog Vol.26,No.April 19