正在加载图片...

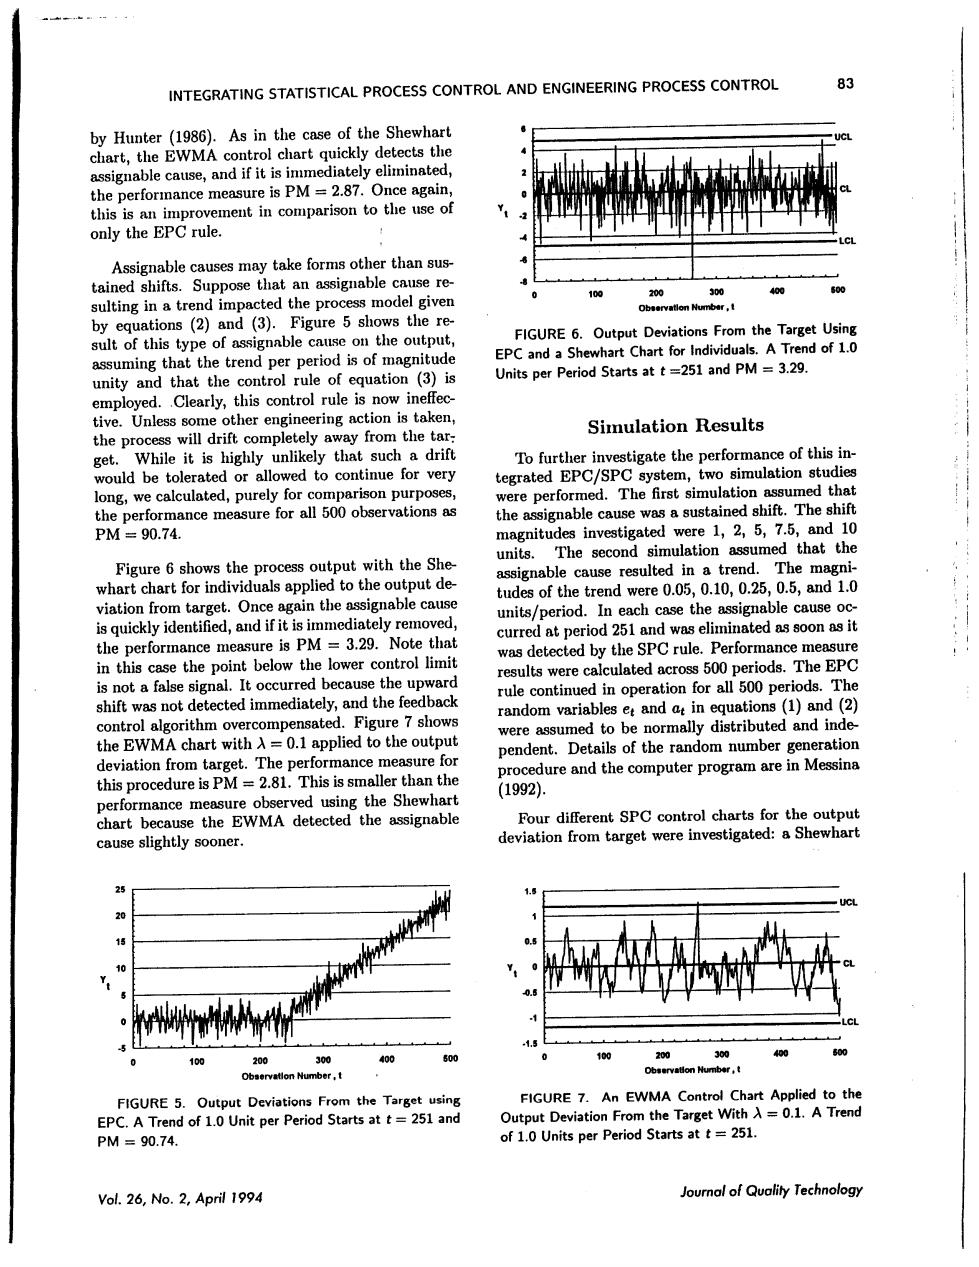
INTEGRATING STATISTICAL PROCESS CONTROL AND ENGINEERING PROCESS CONTROL by Hunte As in the case of the Shewhart rol chart quickly detects the the perforance measure is PM 2.8 able cau ses ma y take form s other than sus that an ignable cause re 1e g in a trend impacted the process model given by equations (2)and (3). Figure 5 shows the FIGURE 6.Outpu ng that the EPC and a y ar of cquation (3)is Units per Period St t=251 and PM=3.29. Clearly,this control rule is now ineffec tive.other engineering ac tion is Simulation Results get be that such a drift to continue for very The first sir fThe shift 1.25,7.5 And 10 The assumed that th Figure6sho with the she put de assignable cause resulted in a trend in the assignable cause tudes of the trend w d vere 0.0: .10 1.0 target.Once is quickly identified,and if it is im units nmediately remo /period. the performance measure is PM curr =3.29 the SPC rule.Performance measure ere periods.The EP signa rule continued in operation for all 500 p (1)ar random variables et and ated.Figure 7 shows d inde the EWMA chart with=0.1 applied to the output the dom number generation e and the computer program are in Messina the Shewhart 1992. Four different SPC control cause slightly sooner. deviation fron target were 4 400 100 on Number, end of 1.0 Unit per Period Starts at t=251 and PM=90.74. Vol.26,No.2,April 1994 Journal of Quality Technolog)