正在加载图片...
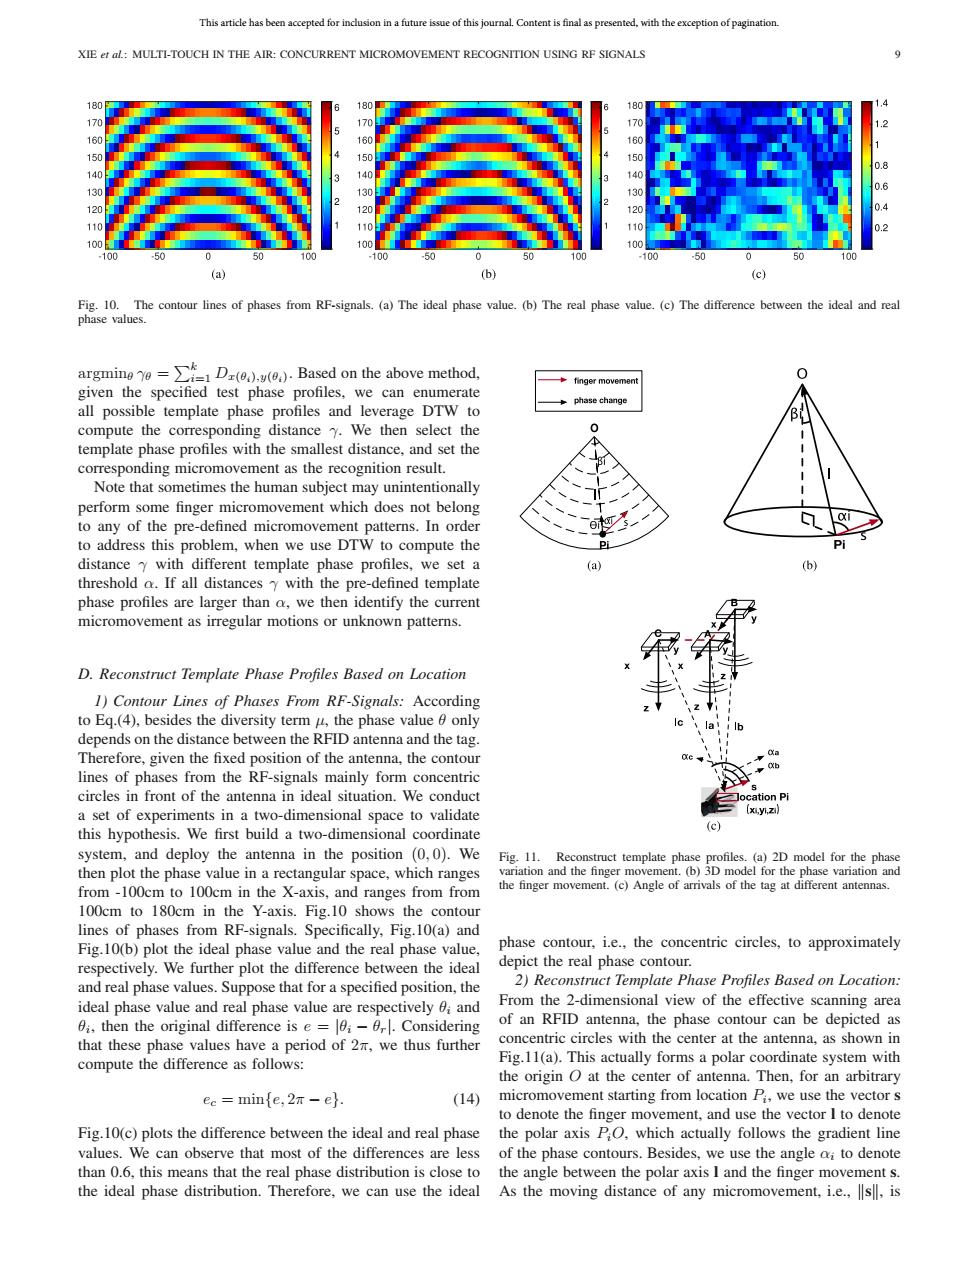
This article has been accepted for inclusion in a future issue of this journal.Content is final as presented,with the exception of pagination. XIE et al:MULTI-TOUCH IN THE AIR:CONCURRENT MICROMOVEMENT RECOGNITION USING RF SIGNALS 0 60 170 170 160 150 0.8 140 0.6 130 130 120 120 0.4 110 110 100 100 100 .10 .100 100 (a) (b) (c) Fig.10.The contour lines of phases from RF-signals.(a)The ideal phase value.(b)The real phase value.(c)The difference between the ideal and real phase values. argmino D))Based on the above method. 0 ◆finger movement given the specified test phase profiles,we can enumerate phase change all possible template phase profiles and leverage DTW to compute the corresponding distance y.We then select the template phase profiles with the smallest distance,and set the corresponding micromovement as the recognition result Note that sometimes the human subject may unintentionally perform some finger micromovement which does not belong to any of the pre-defined micromovement patterns.In order to address this problem,when we use DTW to compute the distance y with different template phase profiles.we set a (b) threshold o.If all distances y with the pre-defined template phase profiles are larger than a,we then identify the current micromovement as irregular motions or unknown patterns. D.Reconstruct Template Phase Profiles Based on Location 1)Contour Lines of Phases From RF-Signals:According to Eq.(4),besides the diversity term u,the phase value only depends on the distance between the RFID antenna and the tag. Therefore,given the fixed position of the antenna,the contour lines of phases from the RF-signals mainly form concentric circles in front of the antenna in ideal situation.We conduct Jocation Pi a set of experiments in a two-dimensional space to validate (xiyi.zi) this hypothesis.We first build a two-dimensional coordinate (c) system,and deploy the antenna in the position (0,0).We Fig.11.Reconstruct template phase profiles.(a)2D model for the phase then plot the phase value in a rectangular space,which ranges variation and the finger movement.(b)3D model for the phase variation and from-100cm to 100cm in the X-axis,and ranges fromfrom the finger movement.(c)Angle of arrivals of the tag at different antennas. 100cm to 180cm in the Y-axis.Fig.10 shows the contour lines of phases from RF-signals.Specifically,Fig.10(a)and Fig.10(b)plot the ideal phase value and the real phase value, phase contour,i.e.,the concentric circles,to approximately respectively.We further plot the difference between the ideal depict the real phase contour. and real phase values.Suppose that for a specified position,the 2)Reconstruct Template Phase Profiles Based on Location: ideal phase value and real phase value are respectively and From the 2-dimensional view of the effective scanning area 0i,then the original difference is e =-0.Considering of an RFID antenna,the phase contour can be depicted as that these phase values have a period of 2m,we thus further concentric circles with the center at the antenna,as shown in compute the difference as follows: Fig.11(a).This actually forms a polar coordinate system with the origin O at the center of antenna.Then,for an arbitrary ec minfe,2n-eh. (14) micromovement starting from location Pi,we use the vector s to denote the finger movement,and use the vector I to denote Fig.10(c)plots the difference between the ideal and real phase the polar axis PO,which actually follows the gradient line values.We can observe that most of the differences are less of the phase contours.Besides,we use the angle ai to denote than 0.6,this means that the real phase distribution is close to the angle between the polar axis I and the finger movement s. the ideal phase distribution.Therefore,we can use the ideal As the moving distance of any micromovement,i.e.,s,isThis article has been accepted for inclusion in a future issue of this journal. Content is final as presented, with the exception of pagination. XIE et al.: MULTI-TOUCH IN THE AIR: CONCURRENT MICROMOVEMENT RECOGNITION USING RF SIGNALS 9 Fig. 10. The contour lines of phases from RF-signals. (a) The ideal phase value. (b) The real phase value. (c) The difference between the ideal and real phase values. argminθ γθ = k i=1 Dx(θi),y(θi). Based on the above method, given the specified test phase profiles, we can enumerate all possible template phase profiles and leverage DTW to compute the corresponding distance γ. We then select the template phase profiles with the smallest distance, and set the corresponding micromovement as the recognition result. Note that sometimes the human subject may unintentionally perform some finger micromovement which does not belong to any of the pre-defined micromovement patterns. In order to address this problem, when we use DTW to compute the distance γ with different template phase profiles, we set a threshold α. If all distances γ with the pre-defined template phase profiles are larger than α, we then identify the current micromovement as irregular motions or unknown patterns. D. Reconstruct Template Phase Profiles Based on Location 1) Contour Lines of Phases From RF-Signals: According to Eq.(4), besides the diversity term μ, the phase value θ only depends on the distance between the RFID antenna and the tag. Therefore, given the fixed position of the antenna, the contour lines of phases from the RF-signals mainly form concentric circles in front of the antenna in ideal situation. We conduct a set of experiments in a two-dimensional space to validate this hypothesis. We first build a two-dimensional coordinate system, and deploy the antenna in the position (0, 0). We then plot the phase value in a rectangular space, which ranges from -100cm to 100cm in the X-axis, and ranges from from 100cm to 180cm in the Y-axis. Fig.10 shows the contour lines of phases from RF-signals. Specifically, Fig.10(a) and Fig.10(b) plot the ideal phase value and the real phase value, respectively. We further plot the difference between the ideal and real phase values. Suppose that for a specified position, the ideal phase value and real phase value are respectively θi and θi, then the original difference is e = |θi − θr|. Considering that these phase values have a period of 2π, we thus further compute the difference as follows: ec = min{e, 2π − e}. (14) Fig.10(c) plots the difference between the ideal and real phase values. We can observe that most of the differences are less than 0.6, this means that the real phase distribution is close to the ideal phase distribution. Therefore, we can use the ideal Fig. 11. Reconstruct template phase profiles. (a) 2D model for the phase variation and the finger movement. (b) 3D model for the phase variation and the finger movement. (c) Angle of arrivals of the tag at different antennas. phase contour, i.e., the concentric circles, to approximately depict the real phase contour. 2) Reconstruct Template Phase Profiles Based on Location: From the 2-dimensional view of the effective scanning area of an RFID antenna, the phase contour can be depicted as concentric circles with the center at the antenna, as shown in Fig.11(a). This actually forms a polar coordinate system with the origin O at the center of antenna. Then, for an arbitrary micromovement starting from location Pi, we use the vector s to denote the finger movement, and use the vector l to denote the polar axis PiO, which actually follows the gradient line of the phase contours. Besides, we use the angle αi to denote the angle between the polar axis l and the finger movement s. As the moving distance of any micromovement, i.e., s, is��