正在加载图片...
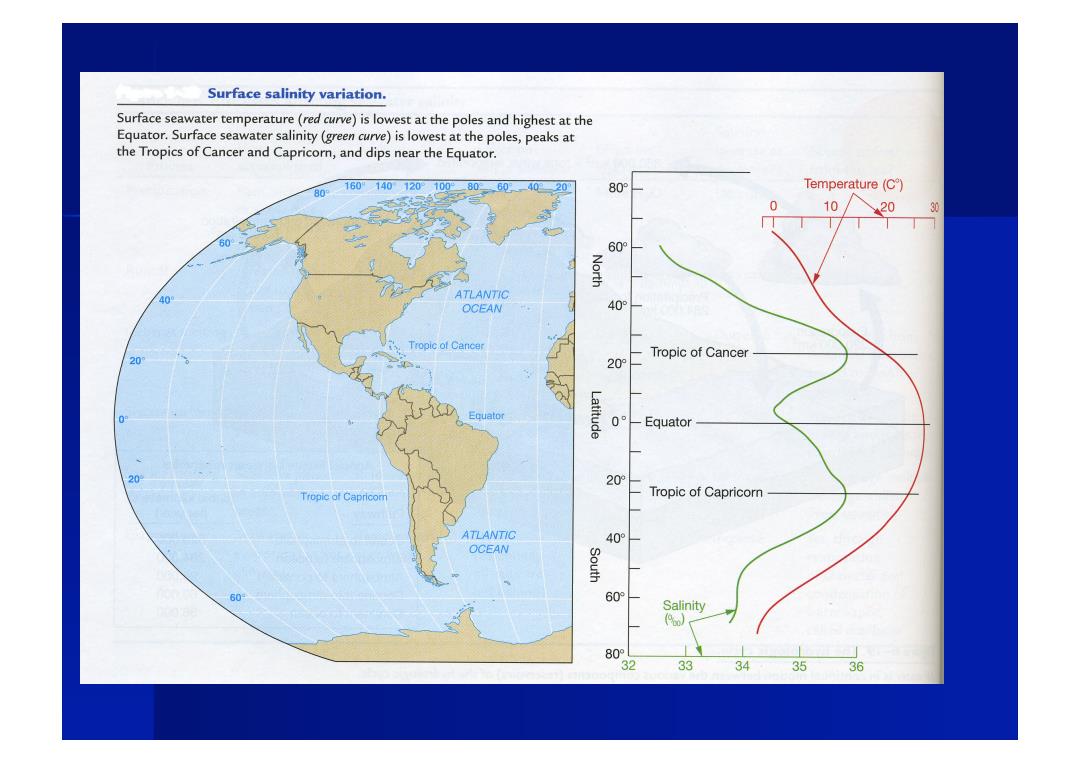
Surface salinity variation. Surface seawater temperature(red curve)is lowest at the poles and highest at the Equator.Surface seawater salinity(green curve)is lowest at the poles,peaks at the Tropics of Cancer and Capricorn,and dips near the Equator. 8016014012000806040220 80° Temperature(C) 0 1020 30 60° 60 North 40 ATLANTIC OCEAN 40 Tropic of Cancer 0 Tropic of Cancer 20 Equator Latitude 0° Equator 20 20° Tropic of Capricom Tropic of Capricorn ATLANTIC 40° OCEAN South 60 60° Salinity (o) 8 32 33 34 35 36