正在加载图片...

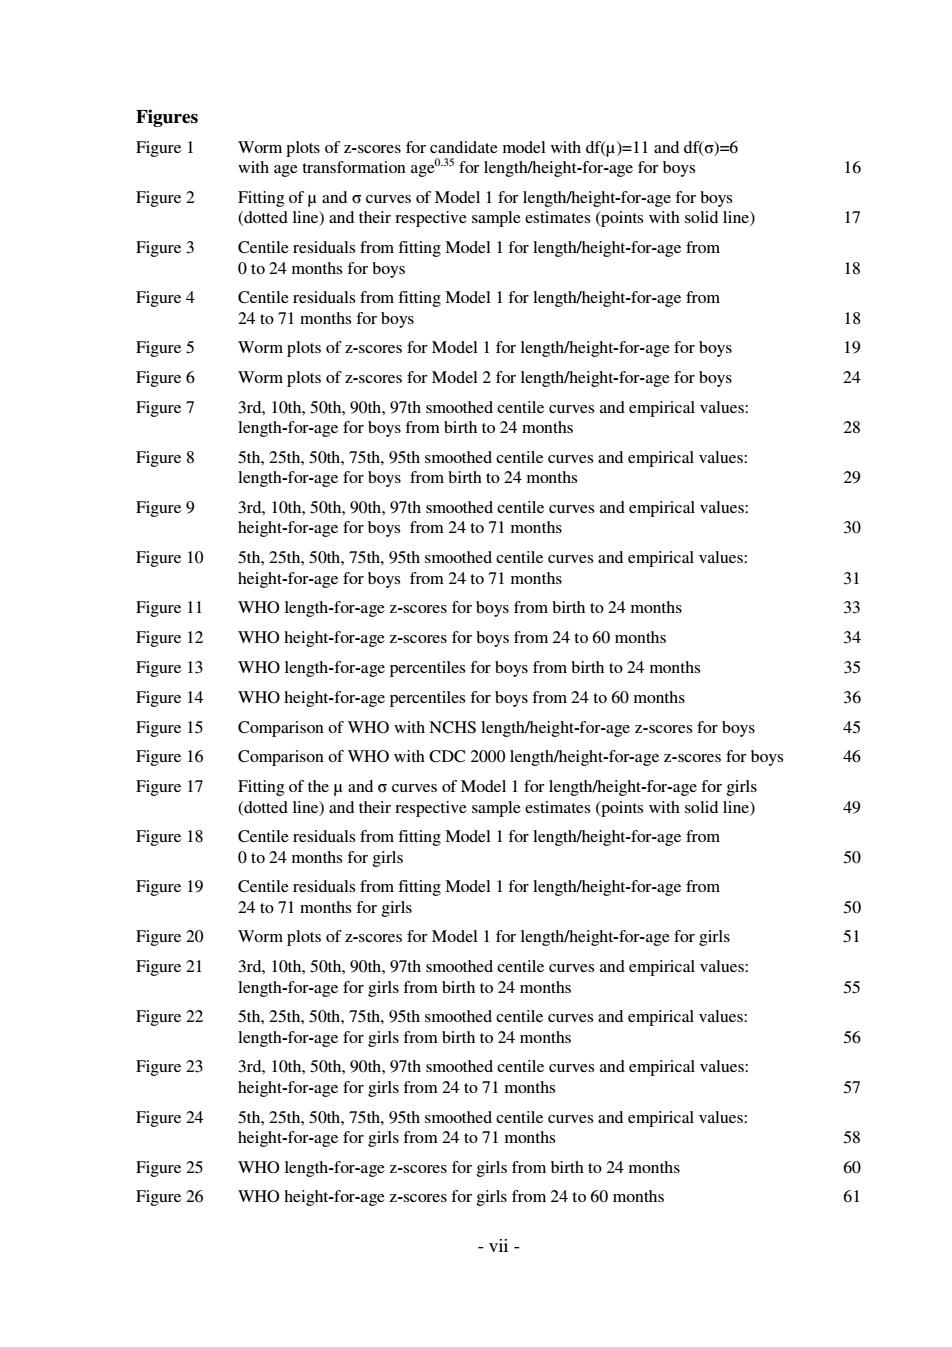
Figures Figure 1 Worm plots of z-scores for candidate model with df(u)=11 and df(o)=6 with age transformation age35 for length/height-for-age for boys 16 Figure 2 Fitting of u and o curves of Model 1 for length/height-for-age for boys (dotted line)and their respective sample estimates(points with solid line) Figure 3 Centile residuals from fitting Model 1 for length/height-for-age from 0 to 24 months for boys 18 Figure 4 Centile residuals from fitting Model 1 for length/height-for-age from 24 to 71 months for boys 18 Figure 5 Worm plots of z-scores for Model 1 for length/height-for-age for boys 19 Figure 6 Worm plots of z-scores for Model 2 for length/height-for-age for boys 24 Figure 7 3rd,10th,50th,90th,97th smoothed centile curves and empirical values: length-for-age for boys from birth to 24 months 28 Figure 8 5th,25th,50th,75th,95th smoothed centile curves and empirical values: length-for-age for boys from birth to 24 months 29 Figure 9 3rd,10th,50th,90th,97th smoothed centile curves and empirical values: height-for-age for boys from 24 to 71 months 30 Figure 10 5th,25th,50th,75th,95th smoothed centile curves and empirical values: height-for-age for boys from 24 to 71 months 31 Figure 11 WHO length-for-age z-scores for boys from birth to 24 months 33 Figure 12 WHO height-for-age z-scores for boys from 24 to 60 months 34 Figure 13 WHO length-for-age percentiles for boys from birth to 24 months 35 Figure 14 WHO height-for-age percentiles for boys from 24 to 60 months 36 Figure 15 Comparison of WHO with NCHS length/height-for-age z-scores for boys 45 Figure 16 Comparison of WHO with CDC 2000 length/height-for-age z-scores for boys 46 Figure 17 Fitting of the u and o curves of Model 1 for length/height-for-age for girls (dotted line)and their respective sample estimates (points with solid line) 49 Figure 18 Centile residuals from fitting Model 1 for length/height-for-age from 0 to 24 months for girls 50 Figure 19 Centile residuals from fitting Model 1 for length/height-for-age from 24 to 71 months for girls 50 Figure 20 Worm plots of z-scores for Model 1 for length/height-for-age for girls 51 Figure 21 3rd,10th,50th,90th,97th smoothed centile curves and empirical values: length-for-age for girls from birth to 24 months 55 Figure 22 5th,25th,50th,75th,95th smoothed centile curves and empirical values: length-for-age for girls from birth to 24 months 56 Figure 23 3rd,10th,50th,90th,97th smoothed centile curves and empirical values: height-for-age for girls from 24 to 71 months 57 Figure 24 5th,25th,50th,75th,95th smoothed centile curves and empirical values: height-for-age for girls from 24 to 71 months 58 Figure 25 WHO length-for-age z-scores for girls from birth to 24 months 60 Figure 26 WHO height-for-age z-scores for girls from 24 to 60 months 61 -vii-- vii - Figures Figure 1 Worm plots of z-scores for candidate model with df(µ)=11 and df(σ)=6 with age transformation age0.35 for length/height-for-age for boys 16 Figure 2 Fitting of µ and σ curves of Model 1 for length/height-for-age for boys (dotted line) and their respective sample estimates (points with solid line) 17 Figure 3 Centile residuals from fitting Model 1 for length/height-for-age from 0 to 24 months for boys 18 Figure 4 Centile residuals from fitting Model 1 for length/height-for-age from 24 to 71 months for boys 18 Figure 5 Worm plots of z-scores for Model 1 for length/height-for-age for boys 19 Figure 6 Worm plots of z-scores for Model 2 for length/height-for-age for boys 24 Figure 7 3rd, 10th, 50th, 90th, 97th smoothed centile curves and empirical values: length-for-age for boys from birth to 24 months 28 Figure 8 5th, 25th, 50th, 75th, 95th smoothed centile curves and empirical values: length-for-age for boys from birth to 24 months 29 Figure 9 3rd, 10th, 50th, 90th, 97th smoothed centile curves and empirical values: height-for-age for boys from 24 to 71 months 30 Figure 10 5th, 25th, 50th, 75th, 95th smoothed centile curves and empirical values: height-for-age for boys from 24 to 71 months 31 Figure 11 WHO length-for-age z-scores for boys from birth to 24 months 33 Figure 12 WHO height-for-age z-scores for boys from 24 to 60 months 34 Figure 13 WHO length-for-age percentiles for boys from birth to 24 months 35 Figure 14 WHO height-for-age percentiles for boys from 24 to 60 months 36 Figure 15 Comparison of WHO with NCHS length/height-for-age z-scores for boys 45 Figure 16 Comparison of WHO with CDC 2000 length/height-for-age z-scores for boys 46 Figure 17 Fitting of the µ and σ curves of Model 1 for length/height-for-age for girls (dotted line) and their respective sample estimates (points with solid line) 49 Figure 18 Centile residuals from fitting Model 1 for length/height-for-age from 0 to 24 months for girls 50 Figure 19 Centile residuals from fitting Model 1 for length/height-for-age from 24 to 71 months for girls 50 Figure 20 Worm plots of z-scores for Model 1 for length/height-for-age for girls 51 Figure 21 3rd, 10th, 50th, 90th, 97th smoothed centile curves and empirical values: length-for-age for girls from birth to 24 months 55 Figure 22 5th, 25th, 50th, 75th, 95th smoothed centile curves and empirical values: length-for-age for girls from birth to 24 months 56 Figure 23 3rd, 10th, 50th, 90th, 97th smoothed centile curves and empirical values: height-for-age for girls from 24 to 71 months 57 Figure 24 5th, 25th, 50th, 75th, 95th smoothed centile curves and empirical values: height-for-age for girls from 24 to 71 months 58 Figure 25 WHO length-for-age z-scores for girls from birth to 24 months 60 Figure 26 WHO height-for-age z-scores for girls from 24 to 60 months 61