正在加载图片...

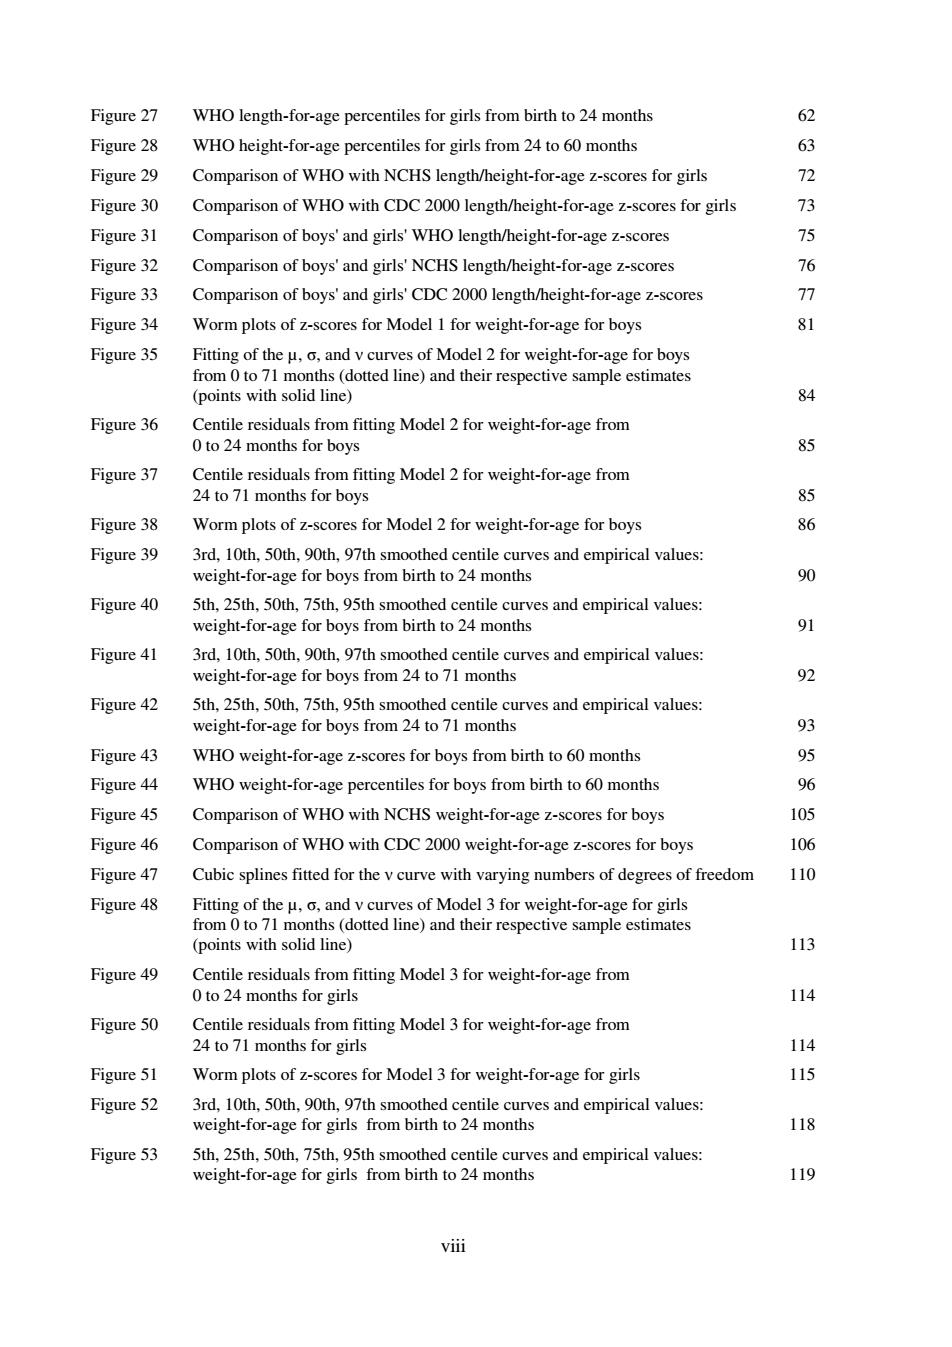
Figure 27 WHO length-for-age percentiles for girls from birth to 24 months 62 Figure 28 WHO height-for-age percentiles for girls from 24 to 60 months 63 Figure 29 Comparison of WHO with NCHS length/height-for-age z-scores for girls 72 Figure 30 Comparison of WHO with CDC 2000 length/height-for-age z-scores for girls 73 Figure 31 Comparison of boys'and girls'WHO length/height-for-age z-scores 75 Figure 32 Comparison of boys'and girls'NCHS length/height-for-age z-scores 76 Figure 33 Comparison of boys'and girls'CDC 2000 length/height-for-age z-scores 77 Figure 34 Worm plots of z-scores for Model 1 for weight-for-age for boys 81 Figure 35 Fitting of the u,o,and v curves of Model 2 for weight-for-age for boys from 0 to 71 months (dotted line)and their respective sample estimates (points with solid line) 84 Figure 36 Centile residuals from fitting Model 2 for weight-for-age from 0 to 24 months for boys 85 Figure 37 Centile residuals from fitting Model 2 for weight-for-age from 24 to 71 months for boys 85 Figure 38 Worm plots of z-scores for Model 2 for weight-for-age for boys 86 Figure 39 3rd,10th,50th,90th,97th smoothed centile curves and empirical values: weight-for-age for boys from birth to 24 months 90 Figure 40 5th,25th,50th,75th,95th smoothed centile curves and empirical values: weight-for-age for boys from birth to 24 months 91 Figure 41 3rd,10th,50th,90th,97th smoothed centile curves and empirical values: weight-for-age for boys from 24 to 71 months 92 Figure 42 5th,25th,50th,75th,95th smoothed centile curves and empirical values: weight-for-age for boys from 24 to 71 months 93 Figure 43 WHO weight-for-age z-scores for boys from birth to 60 months 95 Figure 44 WHO weight-for-age percentiles for boys from birth to 60 months 96 Figure 45 Comparison of WHO with NCHS weight-for-age z-scores for boys 105 Figure 46 Comparison of WHO with CDC 2000 weight-for-age z-scores for boys 106 Figure 47 Cubic splines fitted for the v curve with varying numbers of degrees of freedom 110 Figure 48 Fitting of the u,o,and v curves of Model 3 for weight-for-age for girls from 0 to 71 months(dotted line)and their respective sample estimates (points with solid line) 113 Figure 49 Centile residuals from fitting Model 3 for weight-for-age from 0 to 24 months for girls 114 Figure 50 Centile residuals from fitting Model 3 for weight-for-age from 24 to 71 months for girls 114 Figure 51 Worm plots of z-scores for Model 3 for weight-for-age for girls 115 Figure 52 3rd,10th,50th,90th,97th smoothed centile curves and empirical values: weight-for-age for girls from birth to 24 months 118 Figure 53 5th,25th,50th,75th,95th smoothed centile curves and empirical values: weight-for-age for girls from birth to 24 months 119 viiiviii Figure 27 WHO length-for-age percentiles for girls from birth to 24 months 62 Figure 28 WHO height-for-age percentiles for girls from 24 to 60 months 63 Figure 29 Comparison of WHO with NCHS length/height-for-age z-scores for girls 72 Figure 30 Comparison of WHO with CDC 2000 length/height-for-age z-scores for girls 73 Figure 31 Comparison of boys' and girls' WHO length/height-for-age z-scores 75 Figure 32 Comparison of boys' and girls' NCHS length/height-for-age z-scores 76 Figure 33 Comparison of boys' and girls' CDC 2000 length/height-for-age z-scores 77 Figure 34 Worm plots of z-scores for Model 1 for weight-for-age for boys 81 Figure 35 Fitting of the µ, σ, and ν curves of Model 2 for weight-for-age for boys from 0 to 71 months (dotted line) and their respective sample estimates (points with solid line) 84 Figure 36 Centile residuals from fitting Model 2 for weight-for-age from 0 to 24 months for boys 85 Figure 37 Centile residuals from fitting Model 2 for weight-for-age from 24 to 71 months for boys 85 Figure 38 Worm plots of z-scores for Model 2 for weight-for-age for boys 86 Figure 39 3rd, 10th, 50th, 90th, 97th smoothed centile curves and empirical values: weight-for-age for boys from birth to 24 months 90 Figure 40 5th, 25th, 50th, 75th, 95th smoothed centile curves and empirical values: weight-for-age for boys from birth to 24 months 91 Figure 41 3rd, 10th, 50th, 90th, 97th smoothed centile curves and empirical values: weight-for-age for boys from 24 to 71 months 92 Figure 42 5th, 25th, 50th, 75th, 95th smoothed centile curves and empirical values: weight-for-age for boys from 24 to 71 months 93 Figure 43 WHO weight-for-age z-scores for boys from birth to 60 months 95 Figure 44 WHO weight-for-age percentiles for boys from birth to 60 months 96 Figure 45 Comparison of WHO with NCHS weight-for-age z-scores for boys 105 Figure 46 Comparison of WHO with CDC 2000 weight-for-age z-scores for boys 106 Figure 47 Cubic splines fitted for the ν curve with varying numbers of degrees of freedom 110 Figure 48 Fitting of the µ, σ, and ν curves of Model 3 for weight-for-age for girls from 0 to 71 months (dotted line) and their respective sample estimates (points with solid line) 113 Figure 49 Centile residuals from fitting Model 3 for weight-for-age from 0 to 24 months for girls 114 Figure 50 Centile residuals from fitting Model 3 for weight-for-age from 24 to 71 months for girls 114 Figure 51 Worm plots of z-scores for Model 3 for weight-for-age for girls 115 Figure 52 3rd, 10th, 50th, 90th, 97th smoothed centile curves and empirical values: weight-for-age for girls from birth to 24 months 118 Figure 53 5th, 25th, 50th, 75th, 95th smoothed centile curves and empirical values: weight-for-age for girls from birth to 24 months 119