正在加载图片...

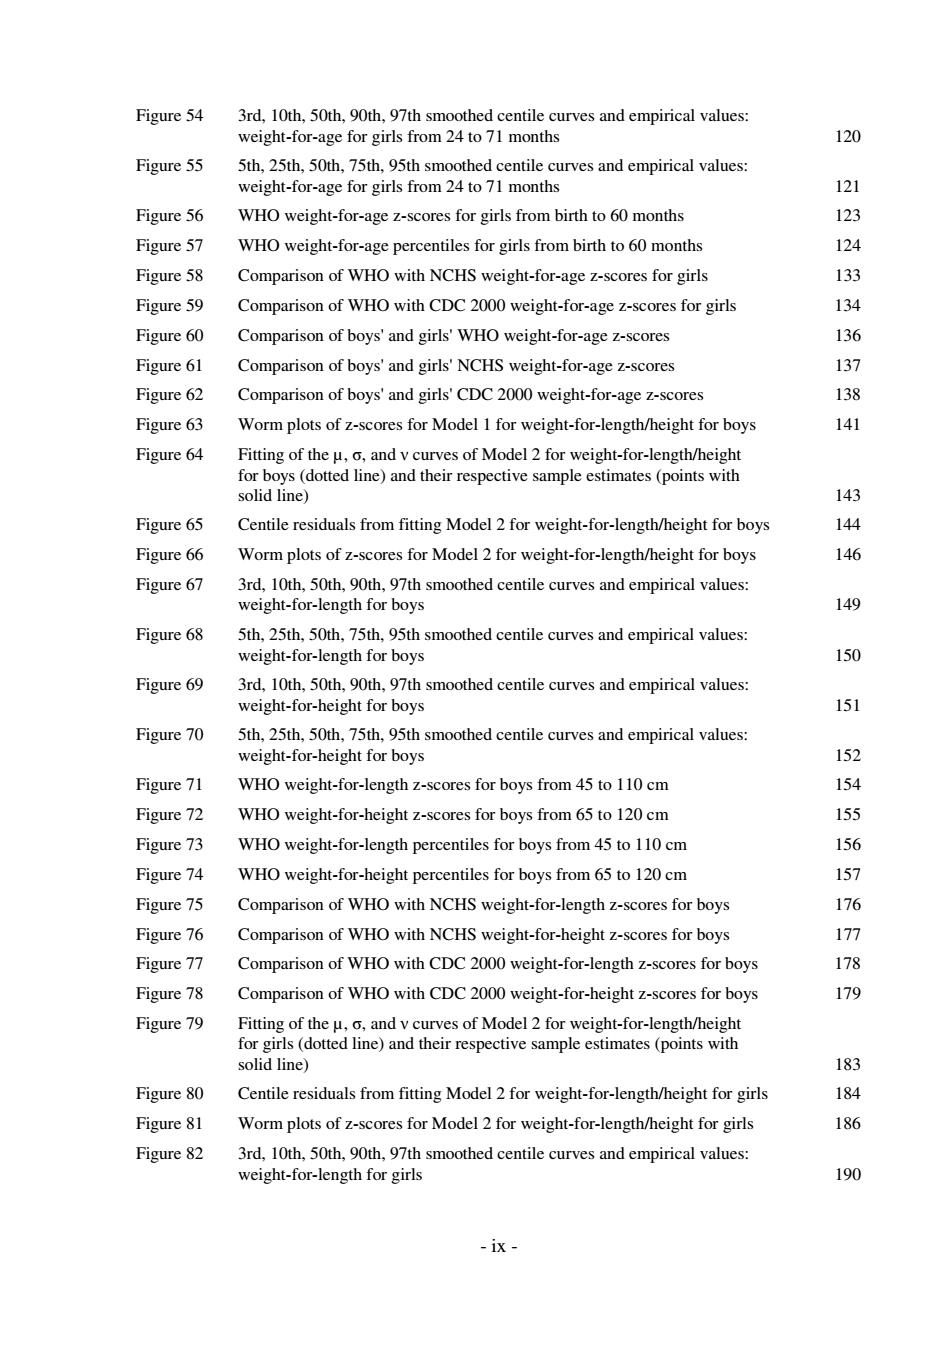
Figure 54 3rd,10th,50th,90th,97th smoothed centile curves and empirical values: weight-for-age for girls from 24 to 71 months 120 Figure 55 5th,25th,50th,75th,95th smoothed centile curves and empirical values: weight-for-age for girls from 24 to 71 months 121 Figure 56 WHO weight-for-age z-scores for girls from birth to 60 months 123 Figure 57 WHO weight-for-age percentiles for girls from birth to 60 months 124 Figure 58 Comparison of WHO with NCHS weight-for-age z-scores for girls 133 Figure 59 Comparison of WHO with CDC 2000 weight-for-age z-scores for girls 134 Figure 60 Comparison of boys'and girls'WHO weight-for-age z-scores 136 Figure 61 Comparison of boys'and girls'NCHS weight-for-age z-scores 137 Figure 62 Comparison of boys'and girls'CDC 2000 weight-for-age z-scores 138 Figure 63 Worm plots of z-scores for Model 1 for weight-for-length/height for boys 141 Figure 64 Fitting of the u,o,and v curves of Model 2 for weight-for-length/height for boys (dotted line)and their respective sample estimates(points with solid line) 143 Figure 65 Centile residuals from fitting Model 2 for weight-for-length/height for boys 144 Figure 66 Worm plots of z-scores for Model 2 for weight-for-length/height for boys 146 Figure 67 3rd,10th,50th,90th,97th smoothed centile curves and empirical values: weight-for-length for boys 149 Figure 68 5th.25th.50th.75th.95th smoothed centile curves and empirical values: weight-for-length for boys 150 Figure 69 3rd,10th,50th,90th,97th smoothed centile curves and empirical values: weight-for-height for boys 151 Figure 70 5th,25th,50th,75th,95th smoothed centile curves and empirical values: weight-for-height for boys 152 Figure 71 WHO weight-for-length z-scores for boys from 45 to 110 cm 154 Figure 72 WHO weight-for-height z-scores for boys from 65 to 120 cm 155 Figure 73 WHO weight-for-length percentiles for boys from 45 to 110 cm 156 Figure 74 WHO weight-for-height percentiles for boys from 65 to 120 cm 157 Figure 75 Comparison of WHO with NCHS weight-for-length z-scores for boys 176 Figure 76 Comparison of WHO with NCHS weight-for-height z-scores for boys 177 Figure 77 Comparison of WHO with CDC 2000 weight-for-length z-scores for boys 178 Figure 78 Comparison of WHO with CDC 2000 weight-for-height z-scores for boys 179 Figure 79 Fitting of the u,o,and v curves of Model 2 for weight-for-length/height for girls(dotted line)and their respective sample estimates(points with solid line) 183 Figure 80 Centile residuals from fitting Model 2 for weight-for-length/height for girls 184 Figure 81 Worm plots of z-scores for Model 2 for weight-for-length/height for girls 186 Figure 82 3rd,10th,50th,90th,97th smoothed centile curves and empirical values: weight-for-length for girls 190 -1x-- ix - Figure 54 3rd, 10th, 50th, 90th, 97th smoothed centile curves and empirical values: weight-for-age for girls from 24 to 71 months 120 Figure 55 5th, 25th, 50th, 75th, 95th smoothed centile curves and empirical values: weight-for-age for girls from 24 to 71 months 121 Figure 56 WHO weight-for-age z-scores for girls from birth to 60 months 123 Figure 57 WHO weight-for-age percentiles for girls from birth to 60 months 124 Figure 58 Comparison of WHO with NCHS weight-for-age z-scores for girls 133 Figure 59 Comparison of WHO with CDC 2000 weight-for-age z-scores for girls 134 Figure 60 Comparison of boys' and girls' WHO weight-for-age z-scores 136 Figure 61 Comparison of boys' and girls' NCHS weight-for-age z-scores 137 Figure 62 Comparison of boys' and girls' CDC 2000 weight-for-age z-scores 138 Figure 63 Worm plots of z-scores for Model 1 for weight-for-length/height for boys 141 Figure 64 Fitting of the µ, σ, and ν curves of Model 2 for weight-for-length/height for boys (dotted line) and their respective sample estimates (points with solid line) 143 Figure 65 Centile residuals from fitting Model 2 for weight-for-length/height for boys 144 Figure 66 Worm plots of z-scores for Model 2 for weight-for-length/height for boys 146 Figure 67 3rd, 10th, 50th, 90th, 97th smoothed centile curves and empirical values: weight-for-length for boys 149 Figure 68 5th, 25th, 50th, 75th, 95th smoothed centile curves and empirical values: weight-for-length for boys 150 Figure 69 3rd, 10th, 50th, 90th, 97th smoothed centile curves and empirical values: weight-for-height for boys 151 Figure 70 5th, 25th, 50th, 75th, 95th smoothed centile curves and empirical values: weight-for-height for boys 152 Figure 71 WHO weight-for-length z-scores for boys from 45 to 110 cm 154 Figure 72 WHO weight-for-height z-scores for boys from 65 to 120 cm 155 Figure 73 WHO weight-for-length percentiles for boys from 45 to 110 cm 156 Figure 74 WHO weight-for-height percentiles for boys from 65 to 120 cm 157 Figure 75 Comparison of WHO with NCHS weight-for-length z-scores for boys 176 Figure 76 Comparison of WHO with NCHS weight-for-height z-scores for boys 177 Figure 77 Comparison of WHO with CDC 2000 weight-for-length z-scores for boys 178 Figure 78 Comparison of WHO with CDC 2000 weight-for-height z-scores for boys 179 Figure 79 Fitting of the µ, σ, and ν curves of Model 2 for weight-for-length/height for girls (dotted line) and their respective sample estimates (points with solid line) 183 Figure 80 Centile residuals from fitting Model 2 for weight-for-length/height for girls 184 Figure 81 Worm plots of z-scores for Model 2 for weight-for-length/height for girls 186 Figure 82 3rd, 10th, 50th, 90th, 97th smoothed centile curves and empirical values: weight-for-length for girls 190