正在加载图片...

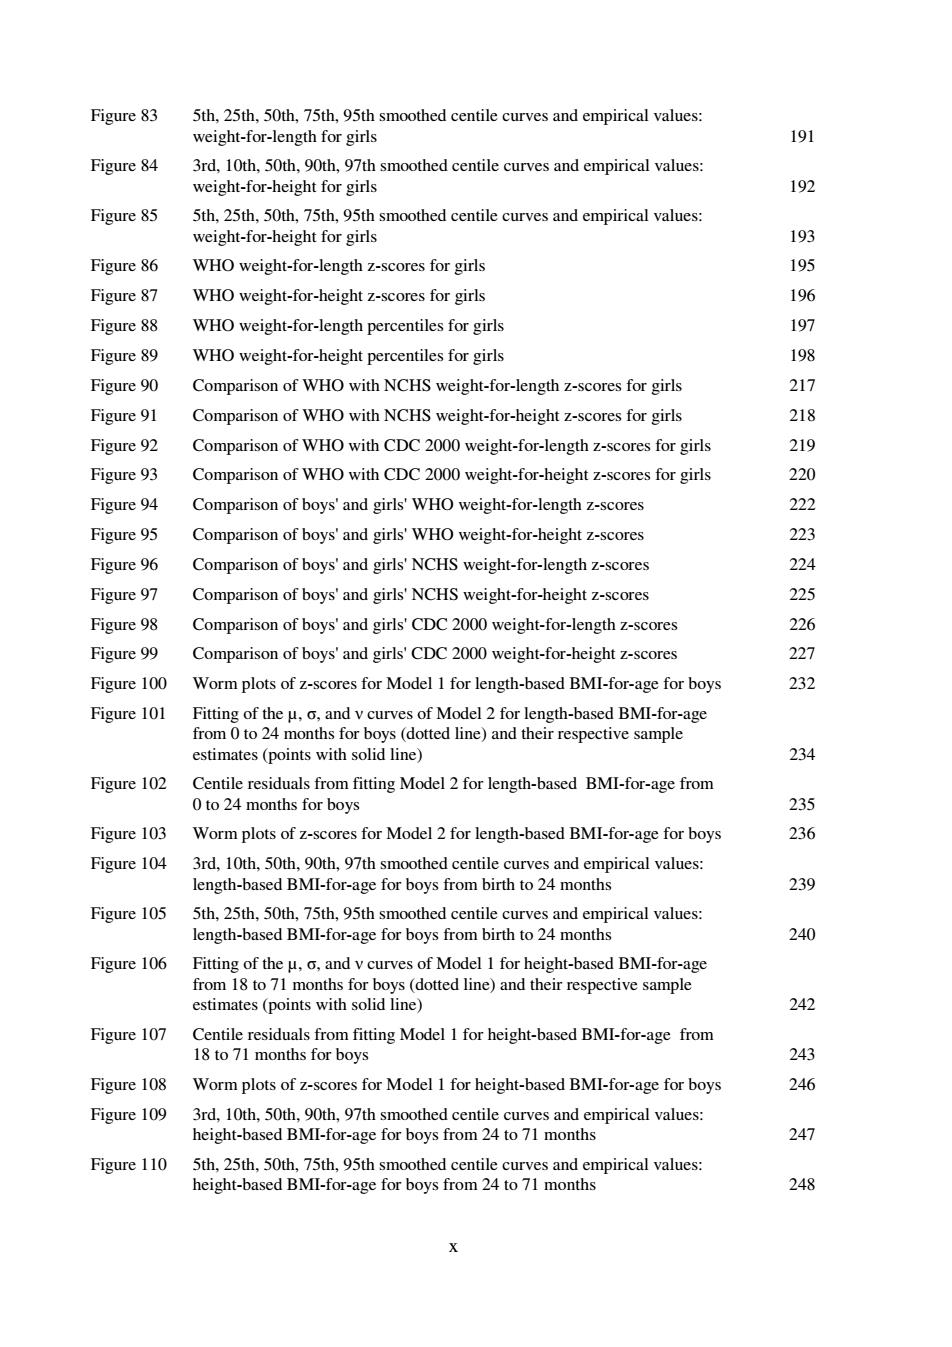
Figure 83 5th,25th,50th,75th,95th smoothed centile curves and empirical values: weight-for-length for girls 191 Figure 84 3rd,10th,50th,90th,97th smoothed centile curves and empirical values: weight-for-height for girls 192 Figure 85 5th,25th,50th,75th,95th smoothed centile curves and empirical values: weight-for-height for girls 193 Figure 86 WHO weight-for-length z-scores for girls 195 Figure 87 WHO weight-for-height z-scores for girls 196 Figure 88 WHO weight-for-length percentiles for girls 197 Figure 89 WHO weight-for-height percentiles for girls 198 Figure 90 Comparison of WHO with NCHS weight-for-length z-scores for girls 217 Figure 91 Comparison of WHO with NCHS weight-for-height z-scores for girls 218 Figure 92 Comparison of WHO with CDC 2000 weight-for-length z-scores for girls 219 Figure 93 Comparison of WHO with CDC 2000 weight-for-height z-scores for girls 220 Figure 94 Comparison of boys'and girls'WHO weight-for-length z-scores 222 Figure 95 Comparison of boys'and girls'WHO weight-for-height z-scores 223 Figure 96 Comparison of boys'and girls'NCHS weight-for-length z-scores 224 Figure 97 Comparison of boys'and girls'NCHS weight-for-height z-scores 225 Figure 98 Comparison of boys'and girls'CDC 2000 weight-for-length z-scores 226 Figure 99 Comparison of boys'and girls'CDC 2000 weight-for-height z-scores 227 Figure 100 Worm plots of z-scores for Model 1 for length-based BMI-for-age for boys 232 Figure 101 Fitting of the u,o,and v curves of Model 2 for length-based BMI-for-age from 0 to 24 months for boys(dotted line)and their respective sample estimates (points with solid line) 234 Figure 102 Centile residuals from fitting Model 2 for length-based BMI-for-age from 0 to 24 months for boys 235 Figure 103 Worm plots of z-scores for Model 2 for length-based BMI-for-age for boys 236 Figure 104 3rd,10th,50th,90th,97th smoothed centile curves and empirical values: length-based BMI-for-age for boys from birth to 24 months 239 Figure 105 5th,25th,50th,75th,95th smoothed centile curves and empirical values: length-based BMI-for-age for boys from birth to 24 months 240 Figure 106 Fitting of the u,o,and v curves of Model 1 for height-based BMI-for-age from 18 to 71 months for boys(dotted line)and their respective sample estimates (points with solid line) 242 Figure 107 Centile residuals from fitting Model 1 for height-based BMI-for-age from 18 to 71 months for boys 243 Figure 108 Worm plots of z-scores for Model 1 for height-based BMI-for-age for boys 246 Figure 109 3rd,10th,50th,90th,97th smoothed centile curves and empirical values: height-based BMI-for-age for boys from 24 to 71 months 247 Figure 110 5th,25th,50th,75th,95th smoothed centile curves and empirical values: height-based BMI-for-age for boys from 24 to 71 months 248x Figure 83 5th, 25th, 50th, 75th, 95th smoothed centile curves and empirical values: weight-for-length for girls 191 Figure 84 3rd, 10th, 50th, 90th, 97th smoothed centile curves and empirical values: weight-for-height for girls 192 Figure 85 5th, 25th, 50th, 75th, 95th smoothed centile curves and empirical values: weight-for-height for girls 193 Figure 86 WHO weight-for-length z-scores for girls 195 Figure 87 WHO weight-for-height z-scores for girls 196 Figure 88 WHO weight-for-length percentiles for girls 197 Figure 89 WHO weight-for-height percentiles for girls 198 Figure 90 Comparison of WHO with NCHS weight-for-length z-scores for girls 217 Figure 91 Comparison of WHO with NCHS weight-for-height z-scores for girls 218 Figure 92 Comparison of WHO with CDC 2000 weight-for-length z-scores for girls 219 Figure 93 Comparison of WHO with CDC 2000 weight-for-height z-scores for girls 220 Figure 94 Comparison of boys' and girls' WHO weight-for-length z-scores 222 Figure 95 Comparison of boys' and girls' WHO weight-for-height z-scores 223 Figure 96 Comparison of boys' and girls' NCHS weight-for-length z-scores 224 Figure 97 Comparison of boys' and girls' NCHS weight-for-height z-scores 225 Figure 98 Comparison of boys' and girls' CDC 2000 weight-for-length z-scores 226 Figure 99 Comparison of boys' and girls' CDC 2000 weight-for-height z-scores 227 Figure 100 Worm plots of z-scores for Model 1 for length-based BMI-for-age for boys 232 Figure 101 Fitting of the µ, σ, and ν curves of Model 2 for length-based BMI-for-age from 0 to 24 months for boys (dotted line) and their respective sample estimates (points with solid line) 234 Figure 102 Centile residuals from fitting Model 2 for length-based BMI-for-age from 0 to 24 months for boys 235 Figure 103 Worm plots of z-scores for Model 2 for length-based BMI-for-age for boys 236 Figure 104 3rd, 10th, 50th, 90th, 97th smoothed centile curves and empirical values: length-based BMI-for-age for boys from birth to 24 months 239 Figure 105 5th, 25th, 50th, 75th, 95th smoothed centile curves and empirical values: length-based BMI-for-age for boys from birth to 24 months 240 Figure 106 Fitting of the µ, σ, and ν curves of Model 1 for height-based BMI-for-age from 18 to 71 months for boys (dotted line) and their respective sample estimates (points with solid line) 242 Figure 107 Centile residuals from fitting Model 1 for height-based BMI-for-age from 18 to 71 months for boys 243 Figure 108 Worm plots of z-scores for Model 1 for height-based BMI-for-age for boys 246 Figure 109 3rd, 10th, 50th, 90th, 97th smoothed centile curves and empirical values: height-based BMI-for-age for boys from 24 to 71 months 247 Figure 110 5th, 25th, 50th, 75th, 95th smoothed centile curves and empirical values: height-based BMI-for-age for boys from 24 to 71 months 248