正在加载图片...

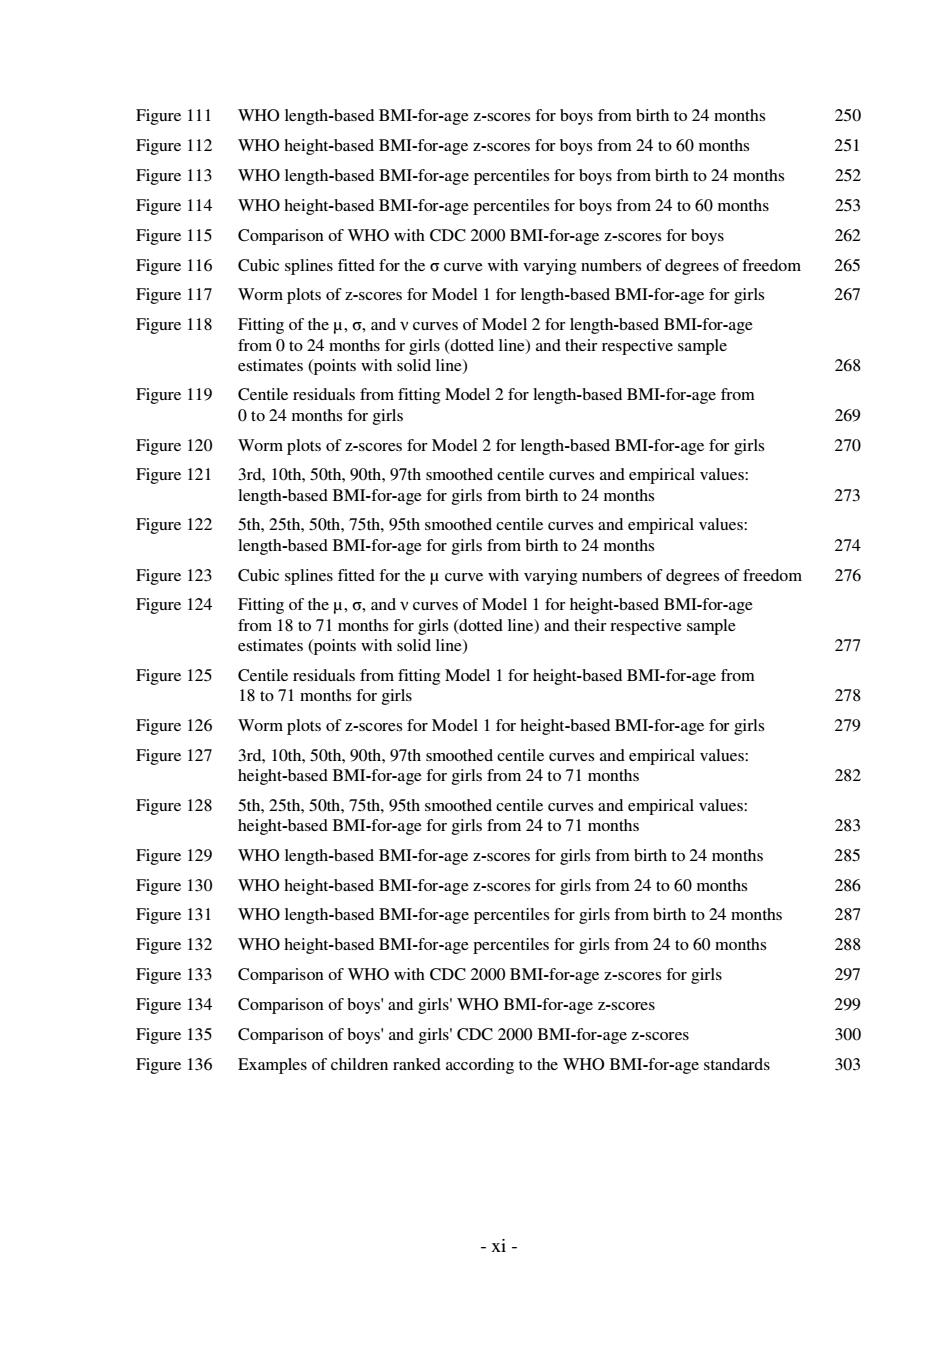
Figure 111 WHO length-based BMI-for-age z-scores for boys from birth to 24 months 250 Figure 112 WHO height-based BMI-for-age z-scores for boys from 24 to 60 months 251 Figure 113 WHO length-based BMI-for-age percentiles for boys from birth to 24 months 252 Figure 114 WHO height-based BMI-for-age percentiles for boys from 24 to 60 months 253 Figure 115 Comparison of WHO with CDC 2000 BMI-for-age z-scores for boys 262 Figure 116 Cubic splines fitted for the o curve with varying numbers of degrees of freedom 265 Figure 117 Worm plots of z-scores for Model 1 for length-based BMI-for-age for girls 267 Figure 118 Fitting of the u,o,and v curves of Model 2 for length-based BMI-for-age from 0 to 24 months for girls(dotted line)and their respective sample estimates (points with solid line) 268 Figure 119 Centile residuals from fitting Model 2 for length-based BMI-for-age from 0 to 24 months for girls 269 Figure 120 Worm plots of z-scores for Model 2 for length-based BMI-for-age for girls 270 Figure 121 3rd,10th,50th,90th,97th smoothed centile curves and empirical values: length-based BMI-for-age for girls from birth to 24 months 273 Figure 122 5th,25th,50th,75th,95th smoothed centile curves and empirical values: length-based BMI-for-age for girls from birth to 24 months 274 Figure 123 Cubic splines fitted for the u curve with varying numbers of degrees of freedom 276 Figure 124 Fitting of the u,o,and v curves of Model 1 for height-based BMI-for-age from 18 to 71 months for girls(dotted line)and their respective sample estimates(points with solid line) 277 Figure 125 Centile residuals from fitting Model 1 for height-based BMI-for-age from 18 to 71 months for girls 278 Figure 126 Worm plots of z-scores for Model 1 for height-based BMI-for-age for girls 279 Figure 127 3rd,10th,50th,90th,97th smoothed centile curves and empirical values: height-based BMI-for-age for girls from 24 to 71 months 282 Figure 128 5th,25th,50th,75th,95th smoothed centile curves and empirical values: height-based BMI-for-age for girls from 24 to 71 months 283 Figure 129 WHO length-based BMI-for-age z-scores for girls from birth to 24 months 285 Figure 130 WHO height-based BMI-for-age z-scores for girls from 24 to 60 months 286 Figure 131 WHO length-based BMI-for-age percentiles for girls from birth to 24 months 287 Figure 132 WHO height-based BMI-for-age percentiles for girls from 24 to 60 months 288 Figure 133 Comparison of WHO with CDC 2000 BMI-for-age z-scores for girls 297 Figure 134 Comparison of boys'and girls'WHO BMI-for-age z-scores 299 Figure 135 Comparison of boys'and girls'CDC 2000 BMI-for-age z-scores 300 Figure 136 Examples of children ranked according to the WHO BMI-for-age standards 303 -xi-- xi - Figure 111 WHO length-based BMI-for-age z-scores for boys from birth to 24 months 250 Figure 112 WHO height-based BMI-for-age z-scores for boys from 24 to 60 months 251 Figure 113 WHO length-based BMI-for-age percentiles for boys from birth to 24 months 252 Figure 114 WHO height-based BMI-for-age percentiles for boys from 24 to 60 months 253 Figure 115 Comparison of WHO with CDC 2000 BMI-for-age z-scores for boys 262 Figure 116 Cubic splines fitted for the σ curve with varying numbers of degrees of freedom 265 Figure 117 Worm plots of z-scores for Model 1 for length-based BMI-for-age for girls 267 Figure 118 Fitting of the µ, σ, and ν curves of Model 2 for length-based BMI-for-age from 0 to 24 months for girls (dotted line) and their respective sample estimates (points with solid line) 268 Figure 119 Centile residuals from fitting Model 2 for length-based BMI-for-age from 0 to 24 months for girls 269 Figure 120 Worm plots of z-scores for Model 2 for length-based BMI-for-age for girls 270 Figure 121 3rd, 10th, 50th, 90th, 97th smoothed centile curves and empirical values: length-based BMI-for-age for girls from birth to 24 months 273 Figure 122 5th, 25th, 50th, 75th, 95th smoothed centile curves and empirical values: length-based BMI-for-age for girls from birth to 24 months 274 Figure 123 Cubic splines fitted for the µ curve with varying numbers of degrees of freedom 276 Figure 124 Fitting of the µ, σ, and ν curves of Model 1 for height-based BMI-for-age from 18 to 71 months for girls (dotted line) and their respective sample estimates (points with solid line) 277 Figure 125 Centile residuals from fitting Model 1 for height-based BMI-for-age from 18 to 71 months for girls 278 Figure 126 Worm plots of z-scores for Model 1 for height-based BMI-for-age for girls 279 Figure 127 3rd, 10th, 50th, 90th, 97th smoothed centile curves and empirical values: height-based BMI-for-age for girls from 24 to 71 months 282 Figure 128 5th, 25th, 50th, 75th, 95th smoothed centile curves and empirical values: height-based BMI-for-age for girls from 24 to 71 months 283 Figure 129 WHO length-based BMI-for-age z-scores for girls from birth to 24 months 285 Figure 130 WHO height-based BMI-for-age z-scores for girls from 24 to 60 months 286 Figure 131 WHO length-based BMI-for-age percentiles for girls from birth to 24 months 287 Figure 132 WHO height-based BMI-for-age percentiles for girls from 24 to 60 months 288 Figure 133 Comparison of WHO with CDC 2000 BMI-for-age z-scores for girls 297 Figure 134 Comparison of boys' and girls' WHO BMI-for-age z-scores 299 Figure 135 Comparison of boys' and girls' CDC 2000 BMI-for-age z-scores 300 Figure 136 Examples of children ranked according to the WHO BMI-for-age standards 303