正在加载图片...

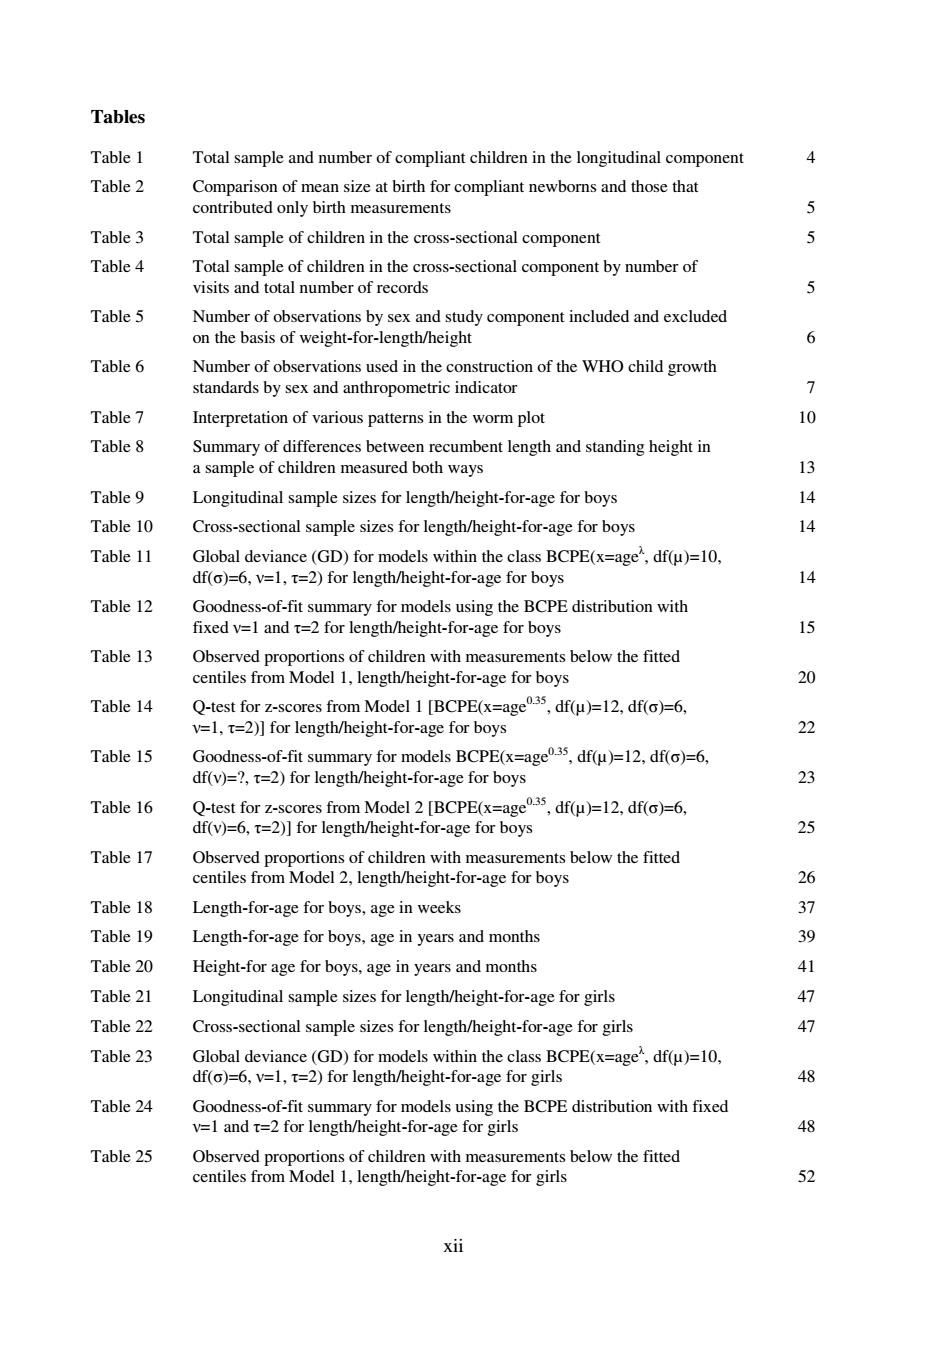
Tables Table 1 Total sample and number of compliant children in the longitudinal component Table 2 Comparison of mean size at birth for compliant newborns and those that contributed only birth measurements Table 3 Total sample of children in the cross-sectional component 5 Table 4 Total sample of children in the cross-sectional component by number of visits and total number of records Table 5 Number of observations by sex and study component included and excluded on the basis of weight-for-length/height 6 Table 6 Number of observations used in the construction of the WHO child growth standards by sex and anthropometric indicator 7 Table 7 Interpretation of various patterns in the worm plot Table 8 Summary of differences between recumbent length and standing height in a sample of children measured both ways 13 Table 9 Longitudinal sample sizes for length/height-for-age for boys 14 Table 10 Cross-sectional sample sizes for length/height-for-age for boys 14 Table 11 Global deviance(GD)for models within the class BCPE(x=age",df(u)=10, df(o)=6,v=1,t=2)for length/height-for-age for boys 14 Table 12 Goodness-of-fit summary for models using the BCPE distribution with fixed v=1 and t=2 for length/height-for-age for boys 15 Table 13 Observed proportions of children with measurements below the fitted centiles from Model 1,length/height-for-age for boys 20 Table 14 Q-test for z-scores from Model 1 [BCPE(x=age5,df(u)=12,df()=6. v=1,t=2)]for length/height-for-age for boys 22 Table 15 Goodness-of-fit summary for models BCPE(x=age35,df(u)=12,df(o)=6, df(v)=?,t=2)for length/height-for-age for boys 23 Table 16 Q-test for z-scores from Model 2 [BCPE(x=age5,df()=12.df()=6, df(v)=6,t=2)]for length/height-for-age for boys 25 Table 17 Observed proportions of children with measurements below the fitted centiles from Model 2,length/height-for-age for boys 26 Table 18 Length-for-age for boys,age in weeks 37 Table 19 Length-for-age for boys,age in years and months 39 Table 20 Height-for age for boys,age in years and months 41 Table 21 Longitudinal sample sizes for length/height-for-age for girls 47 Table 22 Cross-sectional sample sizes for length/height-for-age for girls 47 Table 23 Global deviance(GD)for models within the class BCPE(x=age",df(u)=10, df(o)=6,v=1,t=2)for length/height-for-age for girls 48 Table 24 Goodness-of-fit summary for models using the BCPE distribution with fixed v=1 and t=2 for length/height-for-age for girls 48 Table 25 Observed proportions of children with measurements below the fitted centiles from Model 1,length/height-for-age for girls 52 xiixii Tables Table 1 Total sample and number of compliant children in the longitudinal component 4 Table 2 Comparison of mean size at birth for compliant newborns and those that contributed only birth measurements 5 Table 3 Total sample of children in the cross-sectional component 5 Table 4 Total sample of children in the cross-sectional component by number of visits and total number of records 5 Table 5 Number of observations by sex and study component included and excluded on the basis of weight-for-length/height 6 Table 6 Number of observations used in the construction of the WHO child growth standards by sex and anthropometric indicator 7 Table 7 Interpretation of various patterns in the worm plot 10 Table 8 Summary of differences between recumbent length and standing height in a sample of children measured both ways 13 Table 9 Longitudinal sample sizes for length/height-for-age for boys 14 Table 10 Cross-sectional sample sizes for length/height-for-age for boys 14 Table 11 Global deviance (GD) for models within the class BCPE(x=ageλ , df(µ)=10, df(σ)=6, ν=1, τ=2) for length/height-for-age for boys 14 Table 12 Goodness-of-fit summary for models using the BCPE distribution with fixed ν=1 and τ=2 for length/height-for-age for boys 15 Table 13 Observed proportions of children with measurements below the fitted centiles from Model 1, length/height-for-age for boys 20 Table 14 Q-test for z-scores from Model 1 [BCPE(x=age0.35, df(µ)=12, df(σ)=6, ν=1, τ=2)] for length/height-for-age for boys 22 Table 15 Goodness-of-fit summary for models BCPE(x=age0.35, df(µ)=12, df(σ)=6, df(ν)=?, τ=2) for length/height-for-age for boys 23 Table 16 Q-test for z-scores from Model 2 [BCPE(x=age0.35, df(µ)=12, df(σ)=6, df(ν)=6, τ=2)] for length/height-for-age for boys 25 Table 17 Observed proportions of children with measurements below the fitted centiles from Model 2, length/height-for-age for boys 26 Table 18 Length-for-age for boys, age in weeks 37 Table 19 Length-for-age for boys, age in years and months 39 Table 20 Height-for age for boys, age in years and months 41 Table 21 Longitudinal sample sizes for length/height-for-age for girls 47 Table 22 Cross-sectional sample sizes for length/height-for-age for girls 47 Table 23 Global deviance (GD) for models within the class BCPE(x=ageλ , df(µ)=10, df(σ)=6, ν=1, τ=2) for length/height-for-age for girls 48 Table 24 Goodness-of-fit summary for models using the BCPE distribution with fixed ν=1 and τ=2 for length/height-for-age for girls 48 Table 25 Observed proportions of children with measurements below the fitted centiles from Model 1, length/height-for-age for girls 52