正在加载图片...
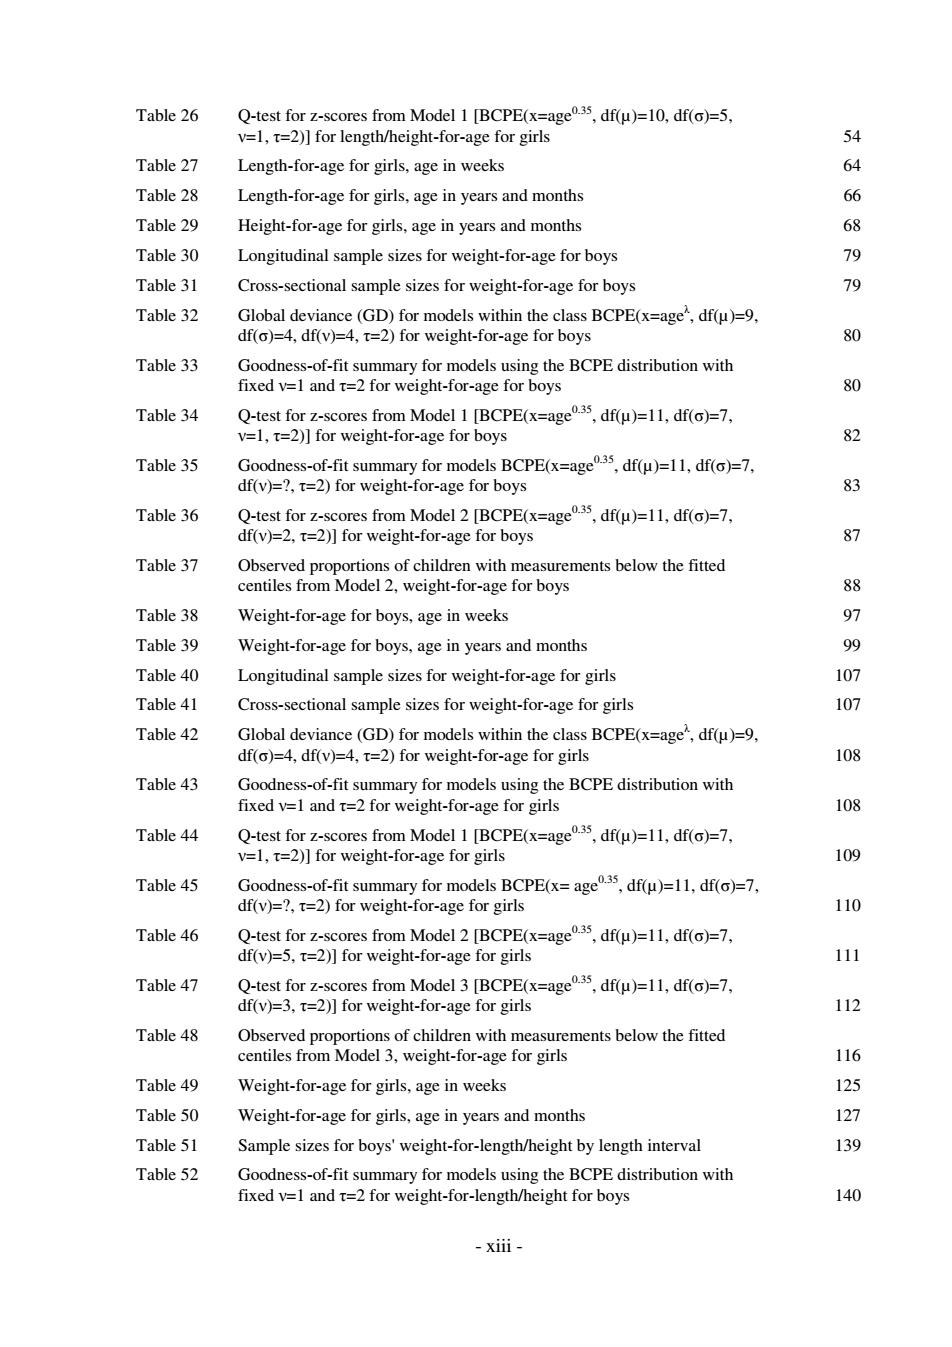
Table 26 Q-test for z-scores from Model 1 [BCPE(x=age3,df(u)=10,df()=5, v=1,t=2)]for length/height-for-age for girls 54 Table 27 Length-for-age for girls,age in weeks 64 Table 28 Length-for-age for girls,age in years and months 66 Table 29 Height-for-age for girls,age in years and months 68 Table 30 Longitudinal sample sizes for weight-for-age for boys 79 Table 31 Cross-sectional sample sizes for weight-for-age for boys 79 Table 32 Global deviance(GD)for models within the class BCPE(x:=age,dfμ))=9, df(o)=4,df(v)=4,t=2)for weight-for-age for boys 80 Table 33 Goodness-of-fit summary for models using the BCPE distribution with fixed v=1 and t=2 for weight-for-age for boys 80 Table 34 Q-test for z-scores from Model 1 [BCPE(x=age5,df(u)=11,df()=7, v=1,t=2)]for weight-for-age for boys 82 Table 35 Goodness-of-fit summary for models BCPE(x=age35,df(u)=11,df()=7, df(v)=?,t=2)for weight-for-age for boys 83 Table 36 Q-test for z-scores from Model 2 [BCPE(x=age35,df(u)=11,df()=7, df(v)=2,t=2)]for weight-for-age for boys 87 Table 37 Observed proportions of children with measurements below the fitted centiles from Model 2,weight-for-age for boys 88 Table 38 Weight-for-age for boys,age in weeks 97 Table 39 Weight-for-age for boys,age in years and months 99 Table 40 Longitudinal sample sizes for weight-for-age for girls 107 Table 41 Cross-sectional sample sizes for weight-for-age for girls 107 Table 42 Global deviance(GD)for models within the class BCPE(x=age,df(u)=9, df(o)=4,df(v)=4,t=2)for weight-for-age for girls 108 Table 43 Goodness-of-fit summary for models using the BCPE distribution with fixed v=1 and t=2 for weight-for-age for girls 108 Table 44 Q-test for z-scores from Model 1 [BCPE(x=age35,df(u)=11,df()=7, v=1,t=2)]for weight-for-age for girls 109 Table 45 Goodness-of-fit summary for models BCPE(x=age35,df(u)=11,df()=7, df(v)=?,t=2)for weight-for-age for girls 110 Table 46 Q-test for z-scores from Model 2 [BCPE(x=agedf()=11,df()=7. df(v)=5,t=2)]for weight-for-age for girls 111 Table 47 Q-test for z-scores from Model3 [BCPE(x=age5,df(u)=11,df()=7, df(v)=3,t=2)]for weight-for-age for girls 112 Table 48 Observed proportions of children with measurements below the fitted centiles from Model 3,weight-for-age for girls 116 Table 49 Weight-for-age for girls,age in weeks 125 Table 50 Weight-for-age for girls,age in years and months 127 Table 51 Sample sizes for boys'weight-for-length/height by length interval 139 Table 52 Goodness-of-fit summary for models using the BCPE distribution with fixed v=1 and t=2 for weight-for-length/height for boys 140 -xiii-- xiii - Table 26 Q-test for z-scores from Model 1 [BCPE(x=age0.35, df(µ)=10, df(σ)=5, ν=1, τ=2)] for length/height-for-age for girls 54 Table 27 Length-for-age for girls, age in weeks 64 Table 28 Length-for-age for girls, age in years and months 66 Table 29 Height-for-age for girls, age in years and months 68 Table 30 Longitudinal sample sizes for weight-for-age for boys 79 Table 31 Cross-sectional sample sizes for weight-for-age for boys 79 Table 32 Global deviance (GD) for models within the class BCPE(x=ageλ , df(µ)=9, df(σ)=4, df(ν)=4, τ=2) for weight-for-age for boys 80 Table 33 Goodness-of-fit summary for models using the BCPE distribution with fixed ν=1 and τ=2 for weight-for-age for boys 80 Table 34 Q-test for z-scores from Model 1 [BCPE(x=age0.35, df(µ)=11, df(σ)=7, ν=1, τ=2)] for weight-for-age for boys 82 Table 35 Goodness-of-fit summary for models BCPE(x=age0.35, df(µ)=11, df(σ)=7, df(ν)=?, τ=2) for weight-for-age for boys 83 Table 36 Q-test for z-scores from Model 2 [BCPE(x=age0.35, df(µ)=11, df(σ)=7, df(ν)=2, τ=2)] for weight-for-age for boys 87 Table 37 Observed proportions of children with measurements below the fitted centiles from Model 2, weight-for-age for boys 88 Table 38 Weight-for-age for boys, age in weeks 97 Table 39 Weight-for-age for boys, age in years and months 99 Table 40 Longitudinal sample sizes for weight-for-age for girls 107 Table 41 Cross-sectional sample sizes for weight-for-age for girls 107 Table 42 Global deviance (GD) for models within the class BCPE(x=ageλ , df(µ)=9, df(σ)=4, df(ν)=4, τ=2) for weight-for-age for girls 108 Table 43 Goodness-of-fit summary for models using the BCPE distribution with fixed ν=1 and τ=2 for weight-for-age for girls 108 Table 44 Q-test for z-scores from Model 1 [BCPE(x=age0.35, df(µ)=11, df(σ)=7, ν=1, τ=2)] for weight-for-age for girls 109 Table 45 Goodness-of-fit summary for models BCPE(x= age0.35, df(µ)=11, df(σ)=7, df(ν)=?, τ=2) for weight-for-age for girls 110 Table 46 Q-test for z-scores from Model 2 [BCPE(x=age0.35, df(µ)=11, df(σ)=7, df(ν)=5, τ=2)] for weight-for-age for girls 111 Table 47 Q-test for z-scores from Model 3 [BCPE(x=age0.35, df(µ)=11, df(σ)=7, df(ν)=3, τ=2)] for weight-for-age for girls 112 Table 48 Observed proportions of children with measurements below the fitted centiles from Model 3, weight-for-age for girls 116 Table 49 Weight-for-age for girls, age in weeks 125 Table 50 Weight-for-age for girls, age in years and months 127 Table 51 Sample sizes for boys' weight-for-length/height by length interval 139 Table 52 Goodness-of-fit summary for models using the BCPE distribution with fixed ν=1 and τ=2 for weight-for-length/height for boys 140