正在加载图片...

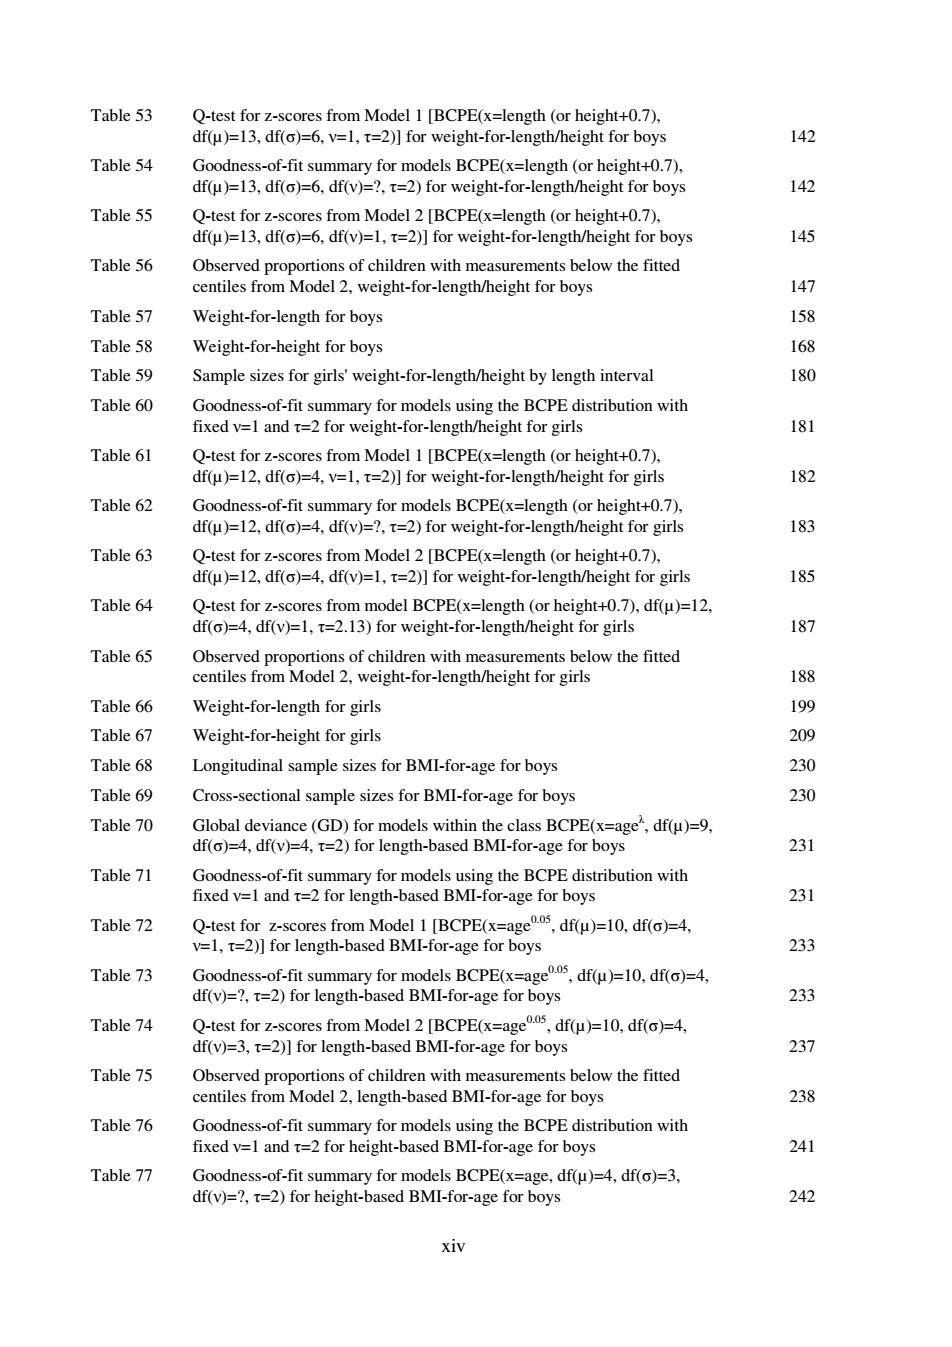
Table 53 Q-test for z-scores from Model 1 [BCPE(x=length (or height+0.7), df(u)=13,df(o)=6,v=1,t=2)]for weight-for-length/height for boys 142 Table 54 Goodness-of-fit summary for models BCPE(x=length(or height+0.7), df(u)=13,df(o)=6,df(v)=?,t=2)for weight-for-length/height for boys 142 Table 55 Q-test for z-scores from Model 2 [BCPE(x=length (or height+0.7), df(u)=13,df(o)=6,df(v)=1,t=2)]for weight-for-length/height for boys 145 Table 56 Observed proportions of children with measurements below the fitted centiles from Model 2,weight-for-length/height for boys 147 Table 57 Weight-for-length for boys 158 Table 58 Weight-for-height for boys 168 Table 59 Sample sizes for girls'weight-for-length/height by length interval 180 Table 60 Goodness-of-fit summary for models using the BCPE distribution with fixed v=1 and t=2 for weight-for-length/height for girls 181 Table 61 Q-test for z-scores from Model 1 [BCPE(x=length (or height+0.7), df(u)=12,df(o)=4,v=1,t=2)]for weight-for-length/height for girls 182 Table 62 Goodness-of-fit summary for models BCPE(x=length (or height+0.7), df(u)=12,df(o)=4,df(v)=?,t=2)for weight-for-length/height for girls 183 Table 63 Q-test for z-scores from Model 2 [BCPE(x=length (or height+0.7). df(u)=12,df(o)=4,df(v)=1,t=2)]for weight-for-length/height for girls 185 Table 64 Q-test for z-scores from model BCPE(x=length (or height+0.7),df(u)=12, df(o)=4,df(v)=1,t=2.13)for weight-for-length/height for girls 187 Table 65 Observed proportions of children with measurements below the fitted centiles from Model 2,weight-for-length/height for girls 188 Table 66 Weight-for-length for girls 199 Table 67 Weight-for-height for girls 209 Table 68 Longitudinal sample sizes for BMI-for-age for boys 230 Table 69 Cross-sectional sample sizes for BMI-for-age for boys 230 Table 70 Global deviance(GD)for models within the class BCPE(x=age",df(u)=9, df(o)=4,df(v)=4,t=2)for length-based BMI-for-age for boys 231 Table 71 Goodness-of-fit summary for models using the BCPE distribution with fixed v=1 and t=2 for length-based BMI-for-age for boys 231 Table 72 Q-test for z-scores from Model 1 [BCPE(x=age05,df(u)=10,df()=4, v=1,t=2)]for length-based BMI-for-age for boys 233 Table 73 Goodness-of-fit summary for models BCPE(x=age5,df()=10,df()=4. df(v)=?,t=2)for length-based BMI-for-age for boys 233 Table 74 Q-test for z-scores from Model 2 [BCPE(x=age5,df(u)=10.df()=4. df(v)=3,t=2)]for length-based BMI-for-age for boys 237 Table 75 Observed proportions of children with measurements below the fitted centiles from Model 2,length-based BMI-for-age for boys 238 Table 76 Goodness-of-fit summary for models using the BCPE distribution with fixed v=1 and t=2 for height-based BMI-for-age for boys 241 Table 77 Goodness-of-fit summary for models BCPE(x=age,df(u)=4,df(o)=3, df(v)=?,t=2)for height-based BMI-for-age for boys 242 xivxiv Table 53 Q-test for z-scores from Model 1 [BCPE(x=length (or height+0.7), df(µ)=13, df(σ)=6, ν=1, τ=2)] for weight-for-length/height for boys 142 Table 54 Goodness-of-fit summary for models BCPE(x=length (or height+0.7), df(µ)=13, df(σ)=6, df(ν)=?, τ=2) for weight-for-length/height for boys 142 Table 55 Q-test for z-scores from Model 2 [BCPE(x=length (or height+0.7), df(µ)=13, df(σ)=6, df(ν)=1, τ=2)] for weight-for-length/height for boys 145 Table 56 Observed proportions of children with measurements below the fitted centiles from Model 2, weight-for-length/height for boys 147 Table 57 Weight-for-length for boys 158 Table 58 Weight-for-height for boys 168 Table 59 Sample sizes for girls' weight-for-length/height by length interval 180 Table 60 Goodness-of-fit summary for models using the BCPE distribution with fixed ν=1 and τ=2 for weight-for-length/height for girls 181 Table 61 Q-test for z-scores from Model 1 [BCPE(x=length (or height+0.7), df(µ)=12, df(σ)=4, ν=1, τ=2)] for weight-for-length/height for girls 182 Table 62 Goodness-of-fit summary for models BCPE(x=length (or height+0.7), df(µ)=12, df(σ)=4, df(ν)=?, τ=2) for weight-for-length/height for girls 183 Table 63 Q-test for z-scores from Model 2 [BCPE(x=length (or height+0.7), df(µ)=12, df(σ)=4, df(ν)=1, τ=2)] for weight-for-length/height for girls 185 Table 64 Q-test for z-scores from model BCPE(x=length (or height+0.7), df(µ)=12, df(σ)=4, df(ν)=1, τ=2.13) for weight-for-length/height for girls 187 Table 65 Observed proportions of children with measurements below the fitted centiles from Model 2, weight-for-length/height for girls 188 Table 66 Weight-for-length for girls 199 Table 67 Weight-for-height for girls 209 Table 68 Longitudinal sample sizes for BMI-for-age for boys 230 Table 69 Cross-sectional sample sizes for BMI-for-age for boys 230 Table 70 Global deviance (GD) for models within the class BCPE(x=ageλ , df(µ)=9, df(σ)=4, df(ν)=4, τ=2) for length-based BMI-for-age for boys 231 Table 71 Goodness-of-fit summary for models using the BCPE distribution with fixed ν=1 and τ=2 for length-based BMI-for-age for boys 231 Table 72 Q-test for z-scores from Model 1 [BCPE(x=age0.05, df(µ)=10, df(σ)=4, ν=1, τ=2)] for length-based BMI-for-age for boys 233 Table 73 Goodness-of-fit summary for models BCPE(x=age0.05, df(µ)=10, df(σ)=4, df(ν)=?, τ=2) for length-based BMI-for-age for boys 233 Table 74 Q-test for z-scores from Model 2 [BCPE(x=age0.05, df(µ)=10, df(σ)=4, df(ν)=3, τ=2)] for length-based BMI-for-age for boys 237 Table 75 Observed proportions of children with measurements below the fitted centiles from Model 2, length-based BMI-for-age for boys 238 Table 76 Goodness-of-fit summary for models using the BCPE distribution with fixed ν=1 and τ=2 for height-based BMI-for-age for boys 241 Table 77 Goodness-of-fit summary for models BCPE(x=age, df(µ)=4, df(σ)=3, df(ν)=?, τ=2) for height-based BMI-for-age for boys 242