正在加载图片...

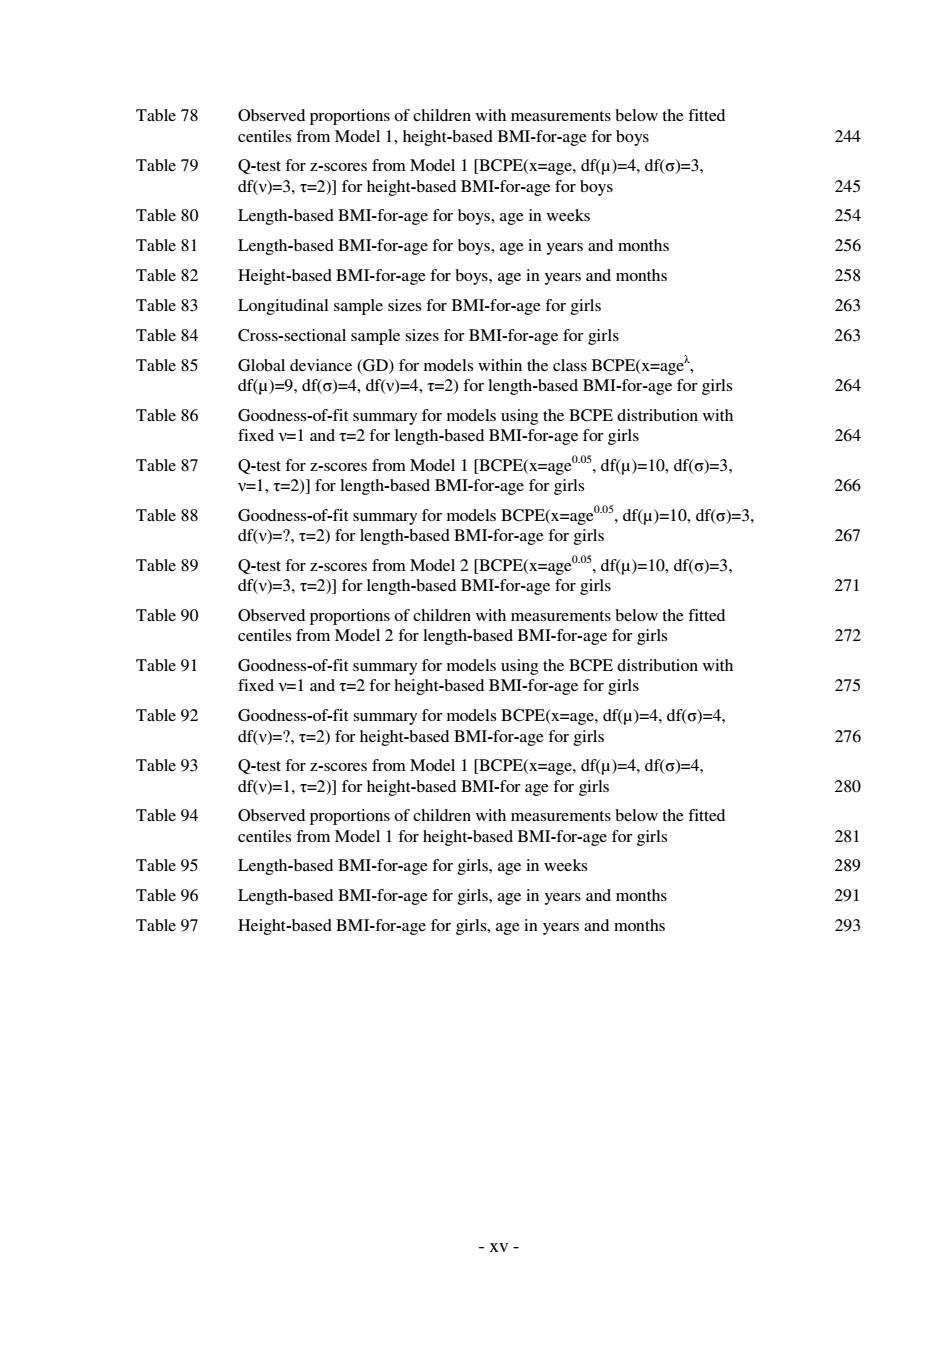
Table 78 Observed proportions of children with measurements below the fitted centiles from Model 1,height-based BMI-for-age for boys 244 Table 79 Q-test for z-scores from Model 1 [BCPE(x=age,df(u)=4,df(o)=3, df(v)=3,t=2)]for height-based BMI-for-age for boys 245 Table 80 Length-based BMI-for-age for boys,age in weeks 254 Table 81 Length-based BMI-for-age for boys,age in years and months 256 Table 82 Height-based BMI-for-age for boys,age in years and months 258 Table 83 Longitudinal sample sizes for BMI-for-age for girls 263 Table 84 Cross-sectional sample sizes for BMI-for-age for girls 263 Table 85 Global deviance(GD)for models within the class BCPE(x=age", df(u)=9,df(o)=4,df(v)=4,t=2)for length-based BMI-for-age for girls 264 Table 86 Goodness-of-fit summary for models using the BCPE distribution with fixed v=1 and t=2 for length-based BMI-for-age for girls 264 Table 87 Q-test for z-scores from Model 1 [BCPE(x=age5,df()=10,df()=3, v=1,t=2)]for length-based BMI-for-age for girls 266 Table 88 Goodness-of-fit summary for models BCPE(x=age05,df(u)=10,df(o)=3, df(v)=?,t=2)for length-based BMI-for-age for girls 267 Table 89 Q-test for z-scores from Model 2 [BCPE(x=age5,df(u)=10,df()=3, df(v)=3,t=2)]for length-based BMI-for-age for girls 271 Table 90 Observed proportions of children with measurements below the fitted centiles from Model 2 for length-based BMI-for-age for girls 272 Table 91 Goodness-of-fit summary for models using the BCPE distribution with fixed v=1 and t=2 for height-based BMI-for-age for girls 275 Table92 Goodness-of-fit summary for models BCPE(x=age,df(u)=4,df(o)=4, df(v)=?,t=2)for height-based BMI-for-age for girls 276 Table93 Q-test for z-scores from Model 1 [BCPE(x=age,df(u)=4,df(o)=4, df(v)=1,t=2)]for height-based BMI-for age for girls 280 Table 94 Observed proportions of children with measurements below the fitted centiles from Model 1 for height-based BMI-for-age for girls 281 Table 95 Length-based BMI-for-age for girls,age in weeks 289 Table 96 Length-based BMI-for-age for girls,age in years and months 291 Table 97 Height-based BMI-for-age for girls,age in years and months 293 XV-- xv - Table 78 Observed proportions of children with measurements below the fitted centiles from Model 1, height-based BMI-for-age for boys 244 Table 79 Q-test for z-scores from Model 1 [BCPE(x=age, df(µ)=4, df(σ)=3, df(ν)=3, τ=2)] for height-based BMI-for-age for boys 245 Table 80 Length-based BMI-for-age for boys, age in weeks 254 Table 81 Length-based BMI-for-age for boys, age in years and months 256 Table 82 Height-based BMI-for-age for boys, age in years and months 258 Table 83 Longitudinal sample sizes for BMI-for-age for girls 263 Table 84 Cross-sectional sample sizes for BMI-for-age for girls 263 Table 85 Global deviance (GD) for models within the class BCPE(x=ageλ , df(µ)=9, df(σ)=4, df(ν)=4, τ=2) for length-based BMI-for-age for girls 264 Table 86 Goodness-of-fit summary for models using the BCPE distribution with fixed ν=1 and τ=2 for length-based BMI-for-age for girls 264 Table 87 Q-test for z-scores from Model 1 [BCPE(x=age0.05, df(µ)=10, df(σ)=3, ν=1, τ=2)] for length-based BMI-for-age for girls 266 Table 88 Goodness-of-fit summary for models BCPE(x=age0.05, df(µ)=10, df(σ)=3, df(ν)=?, τ=2) for length-based BMI-for-age for girls 267 Table 89 Q-test for z-scores from Model 2 [BCPE(x=age0.05, df(µ)=10, df(σ)=3, df(ν)=3, τ=2)] for length-based BMI-for-age for girls 271 Table 90 Observed proportions of children with measurements below the fitted centiles from Model 2 for length-based BMI-for-age for girls 272 Table 91 Goodness-of-fit summary for models using the BCPE distribution with fixed ν=1 and τ=2 for height-based BMI-for-age for girls 275 Table 92 Goodness-of-fit summary for models BCPE(x=age, df(µ)=4, df(σ)=4, df(ν)=?, τ=2) for height-based BMI-for-age for girls 276 Table 93 Q-test for z-scores from Model 1 [BCPE(x=age, df(µ)=4, df(σ)=4, df(ν)=1, τ=2)] for height-based BMI-for age for girls 280 Table 94 Observed proportions of children with measurements below the fitted centiles from Model 1 for height-based BMI-for-age for girls 281 Table 95 Length-based BMI-for-age for girls, age in weeks 289 Table 96 Length-based BMI-for-age for girls, age in years and months 291 Table 97 Height-based BMI-for-age for girls, age in years and months 293