正在加载图片...

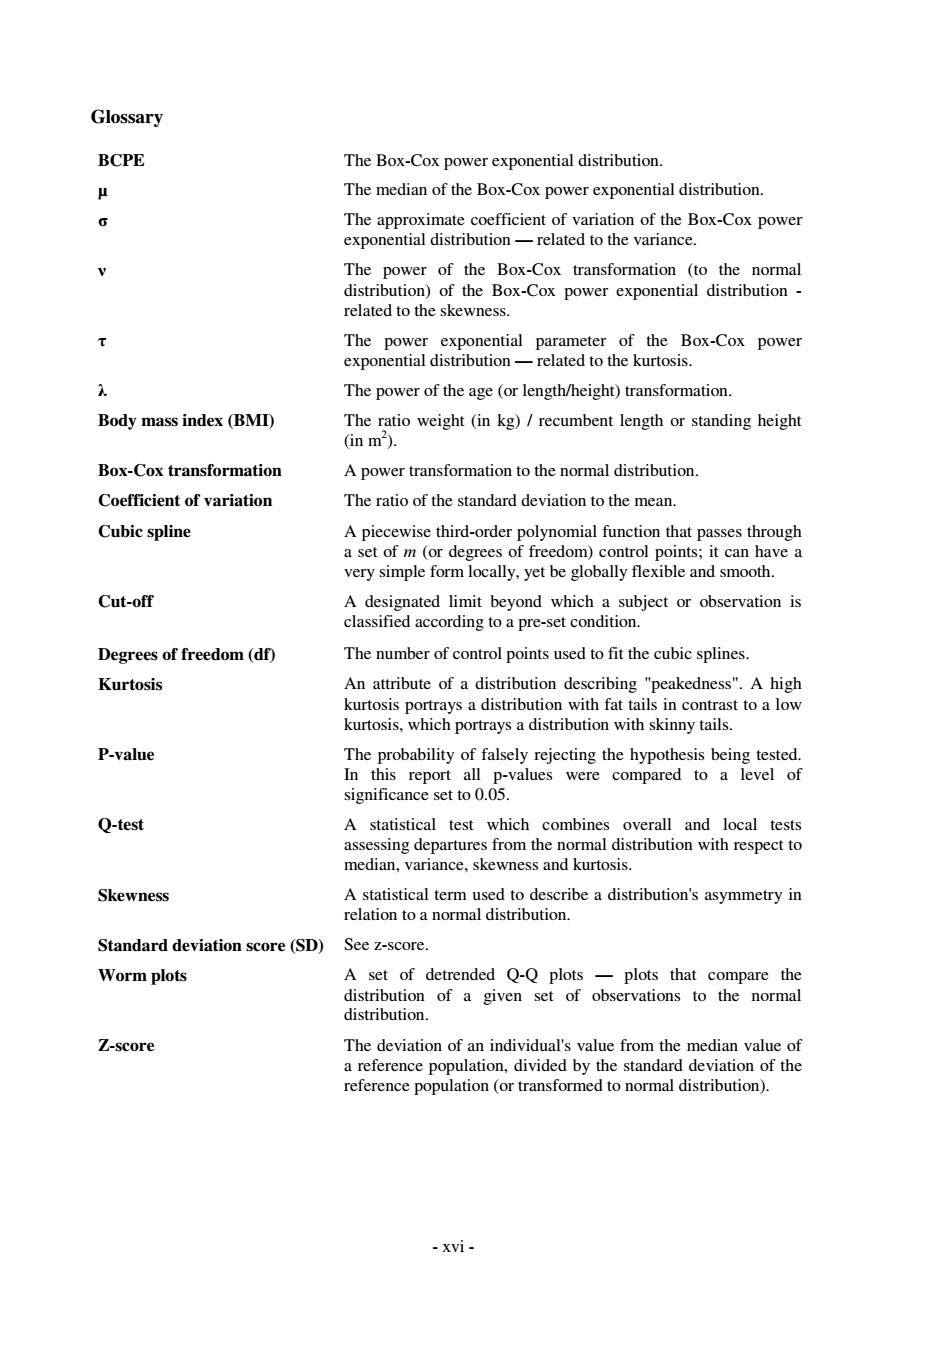
Glossary BCPE The Box-Cox power exponential distribution. The median of the Box-Cox power exponential distribution. The approximate coefficient of variation of the Box-Cox power exponential distribution-related to the variance. The power of the Box-Cox transformation (to the normal distribution)of the Box-Cox power exponential distribution related to the skewness. The power exponential parameter of the Box-Cox power exponential distribution-related to the kurtosis. The power of the age (or length/height)transformation. Body mass index (BMD) The ratio weight (in kg)/recumbent length or standing height (in m). Box-Cox transformation A power transformation to the normal distribution. Coefficient of variation The ratio of the standard deviation to the mean. Cubic spline A piecewise third-order polynomial function that passes through a set of m (or degrees of freedom)control points;it can have a very simple form locally,yet be globally flexible and smooth. Cut-off A designated limit beyond which a subject or observation is classified according to a pre-set condition. Degrees of freedom(df) The number of control points used to fit the cubic splines. Kurtosis An attribute of a distribution describing "peakedness".A high kurtosis portrays a distribution with fat tails in contrast to a low kurtosis,which portrays a distribution with skinny tails. P-value The probability of falsely rejecting the hypothesis being tested. In this report all p-values were compared to a level of significance set to 0.05. Q-test A statistical test which combines overall and local tests assessing departures from the normal distribution with respect to median,variance,skewness and kurtosis. Skewness A statistical term used to describe a distribution's asymmetry in relation to a normal distribution. Standard deviation score (SD) See z-score Worm plots A set of detrended Q-Q plots -plots that compare the distribution of a given set of observations to the normal distribution. Z-score The deviation of an individual's value from the median value of a reference population,divided by the standard deviation of the reference population(or transformed to normal distribution). -xvi-- xvi - Glossary BCPE The Box-Cox power exponential distribution. µ The median of the Box-Cox power exponential distribution. σ The approximate coefficient of variation of the Box-Cox power exponential distribution — related to the variance. ν The power of the Box-Cox transformation (to the normal distribution) of the Box-Cox power exponential distribution - related to the skewness. τ The power exponential parameter of the Box-Cox power exponential distribution — related to the kurtosis. λ The power of the age (or length/height) transformation. Body mass index (BMI) The ratio weight (in kg) / recumbent length or standing height (in m2 ). Box-Cox transformation A power transformation to the normal distribution. Coefficient of variation The ratio of the standard deviation to the mean. Cubic spline A piecewise third-order polynomial function that passes through a set of m (or degrees of freedom) control points; it can have a very simple form locally, yet be globally flexible and smooth. Cut-off A designated limit beyond which a subject or observation is classified according to a pre-set condition. Degrees of freedom (df) The number of control points used to fit the cubic splines. Kurtosis An attribute of a distribution describing "peakedness". A high kurtosis portrays a distribution with fat tails in contrast to a low kurtosis, which portrays a distribution with skinny tails. P-value The probability of falsely rejecting the hypothesis being tested. In this report all p-values were compared to a level of significance set to 0.05. Q-test A statistical test which combines overall and local tests assessing departures from the normal distribution with respect to median, variance, skewness and kurtosis. Skewness A statistical term used to describe a distribution's asymmetry in relation to a normal distribution. Standard deviation score (SD) See z-score. Worm plots A set of detrended Q-Q plots — plots that compare the distribution of a given set of observations to the normal distribution. Z-score The deviation of an individual's value from the median value of a reference population, divided by the standard deviation of the reference population (or transformed to normal distribution)