正在加载图片...
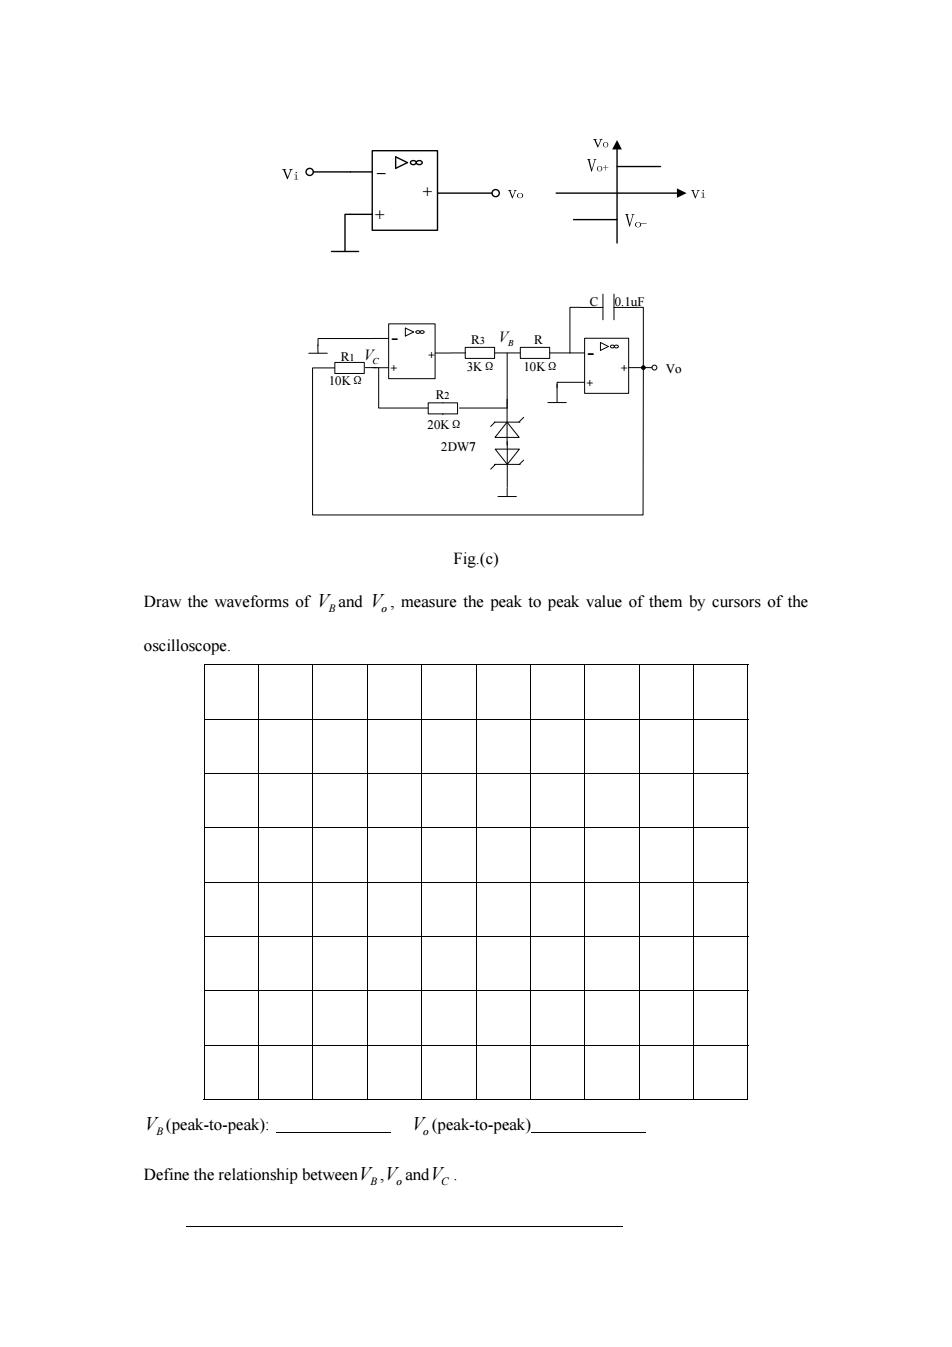
Vo◆ Vot C 0.luF R3 Va R RI V 3KQ 10KQ 0 Vo 10K2 R2 20KQ 2DW7 Fig.(c) Draw the waveforms of Veand V,measure the peak to peak value of them by cursors of the oscilloscope Va(peak-to-peak): V(peak-to-peak). Define the relationship betweenand Vo 2DW7 R2 20KΩ R3 3KΩ 10KΩ R R1 10KΩ C 0.1uF VB VC Fig.(c) Draw the waveforms of VB and Vo , measure the peak to peak value of them by cursors of the oscilloscope. VB (peak-to-peak): Vo (peak-to-peak) Define the relationship betweenVB ,Vo andVC