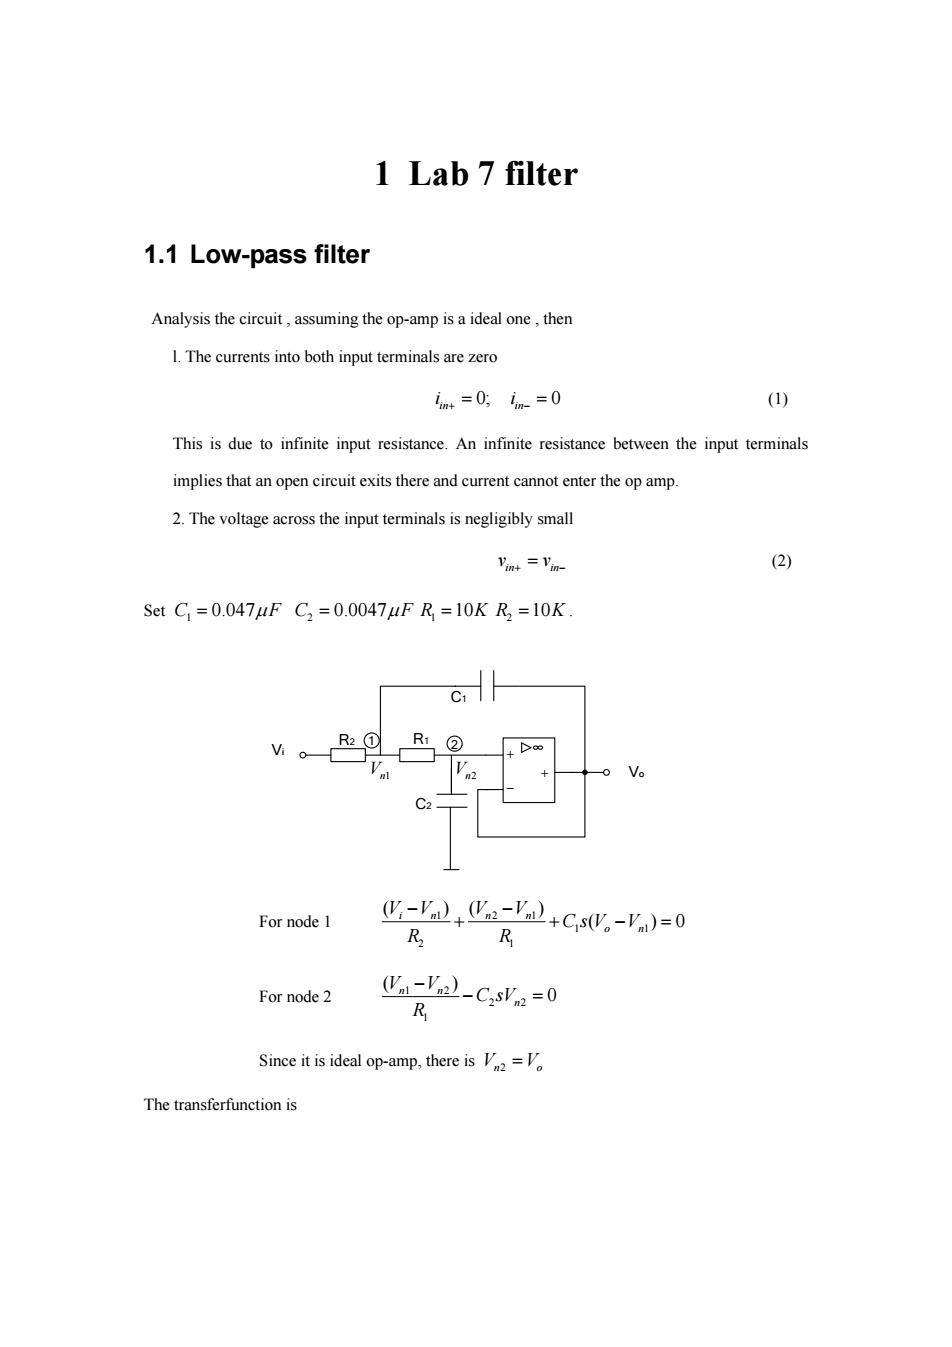
1 Lab 7 filter 1.1 Low-pass filter Analysis the circuit,assuming the op-amp is a ideal one,then 1.The currents into both input terminals are zero m+=0,n-=0 (1) This is due to infinite input resistance.An infinite resistance between the input terminals implies that an open circuit exits there and current cannot enter the op amp. 2.The voltage across the input terminals is negligibly small Vint =Vin- (2) SetC=0.047uFC2=0.0047uFR=10KR2=10K C1 For node 1 -'+a-'2+CsW。-V)=0 R R For node 2 (Va-Va)-CsVn=0 R Since it is ideal op-amp,there isV=V The transferfunction is
1 Lab 7 filter 1.1 Low-pass filter Analysis the circuit , assuming the op-amp is a ideal one , then l. The currents into both input terminals are zero 0; 0 in in i i (1) This is due to infinite input resistance. An infinite resistance between the input terminals implies that an open circuit exits there and current cannot enter the op amp. 2. The voltage across the input terminals is negligibly small in in v v (2) Set 1 C F 0.047 2 C F 0.0047 1 R 10K 2 R 10K . C1 R2 R1 C2 Vo Vi 1 2 Vn1 Vn2 For node 1 1 21 1 1 2 1 ( )( ) ( )0 in n n o n VV V V CsV V R R For node 2 1 2 2 2 1 ( ) 0 n n n V V C sV R Since it is ideal op-amp, there is V V n o 2 The transferfunction is
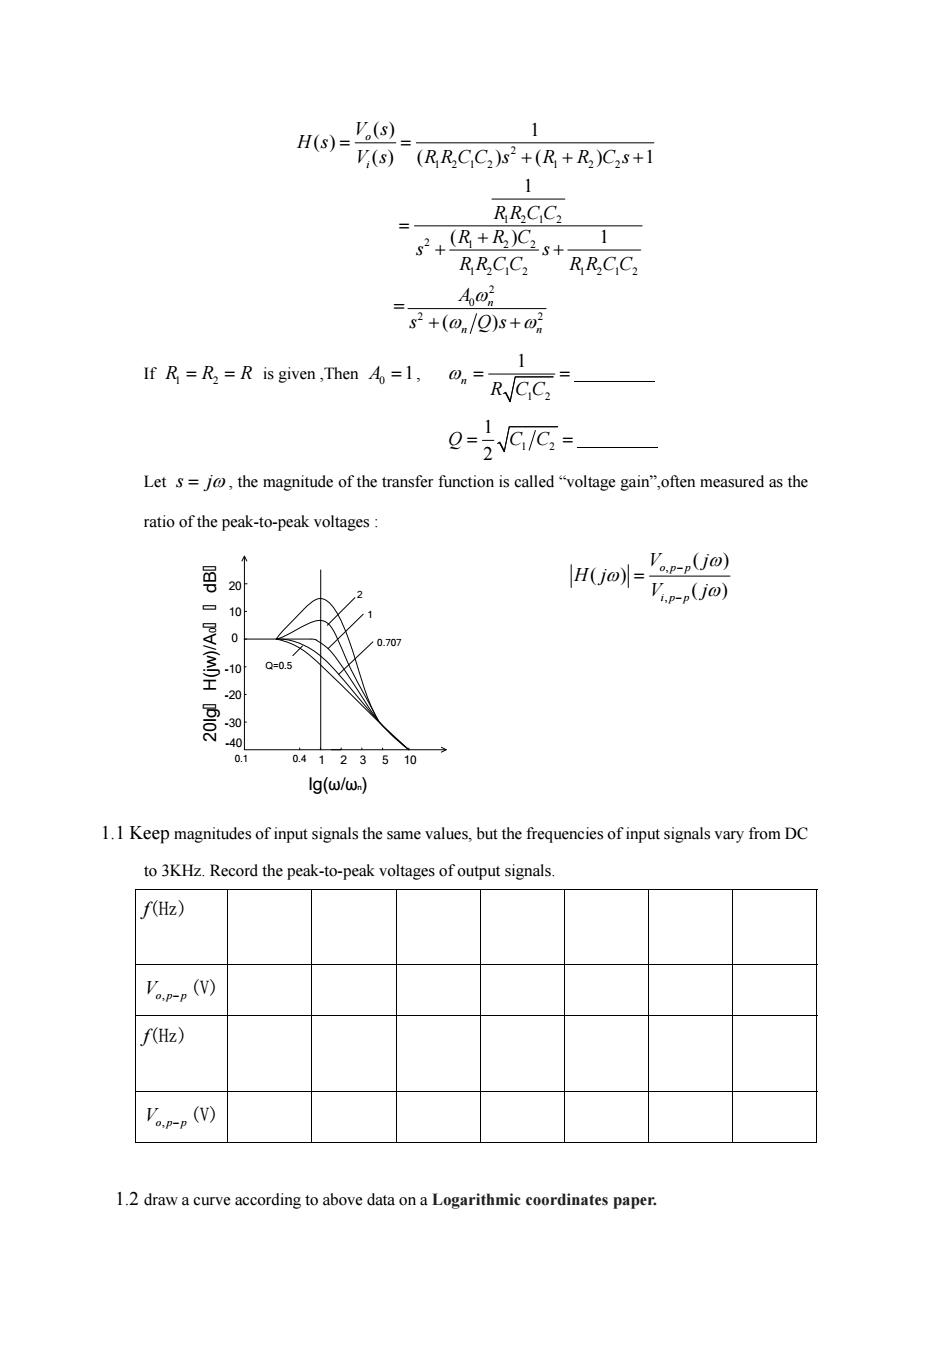
H(s)= '(s) V(s)(RRCC)s2+(R+R)C2s+1 1 RRCC2 (R+R)C.s+ 1 RRCC2 RCC2 Ao斤 s2+(@/Q)s+0 IR=R is given,Then1RCC 0- Let s=jo,the magnitude of the transfer function is called"voltage gain",often measured as the ratio of the peak-to-peak voltages 'op-pUo) H(jo-Tp-pOo) 10 0 0.707 -10 Q=0.5 20 -30 40 0.1 0.4123510 Ig(w/w.) 1.1 Keep magnitudes of input signals the same values,but the frequencies of input signals vary from DC to 3KHz.Record the peak-to-peak voltages of output signals. f(Hz) p-p(W f(Hz) Vp-p() 1.2 draw a curve according to above data on a Logarithmic coordinates paper
2 1212 1 2 2 1212 2 1 22 1212 1212 2 0 2 2 ( ) 1 ( ) () ( ) ( ) 1 1 ( ) 1 = ( ) o i n n n V s H s V s RRCC s R R C s RRCC R RC s s RRCC RRCC A s Qs If R1 2 R R is given ,Then 0 A 1, 1 2 1 n R CC 1 2 1 2 Q CC Let s j , the magnitude of the transfer function is called “voltage gain”,often measured as the ratio of the peak-to-peak voltages : 20 10 0 -10 -20 -30 -40 0.1 0.4 1 2 3 5 10 lg(ω/ωn) 20lg H(jw)/A0 dB 1 2 0.707 Q=0.5 , , ( ) ( ) ( ) op p ip p V j H j V j 1.1 Keep magnitudes of input signals the same values, but the frequencies of input signals vary from DC to 3KHz. Record the peak-to-peak voltages of output signals. f(Hz) Vop p , (V) f(Hz) Vop p , (V) 1.2 draw a curve according to above data on a Logarithmic coordinates paper
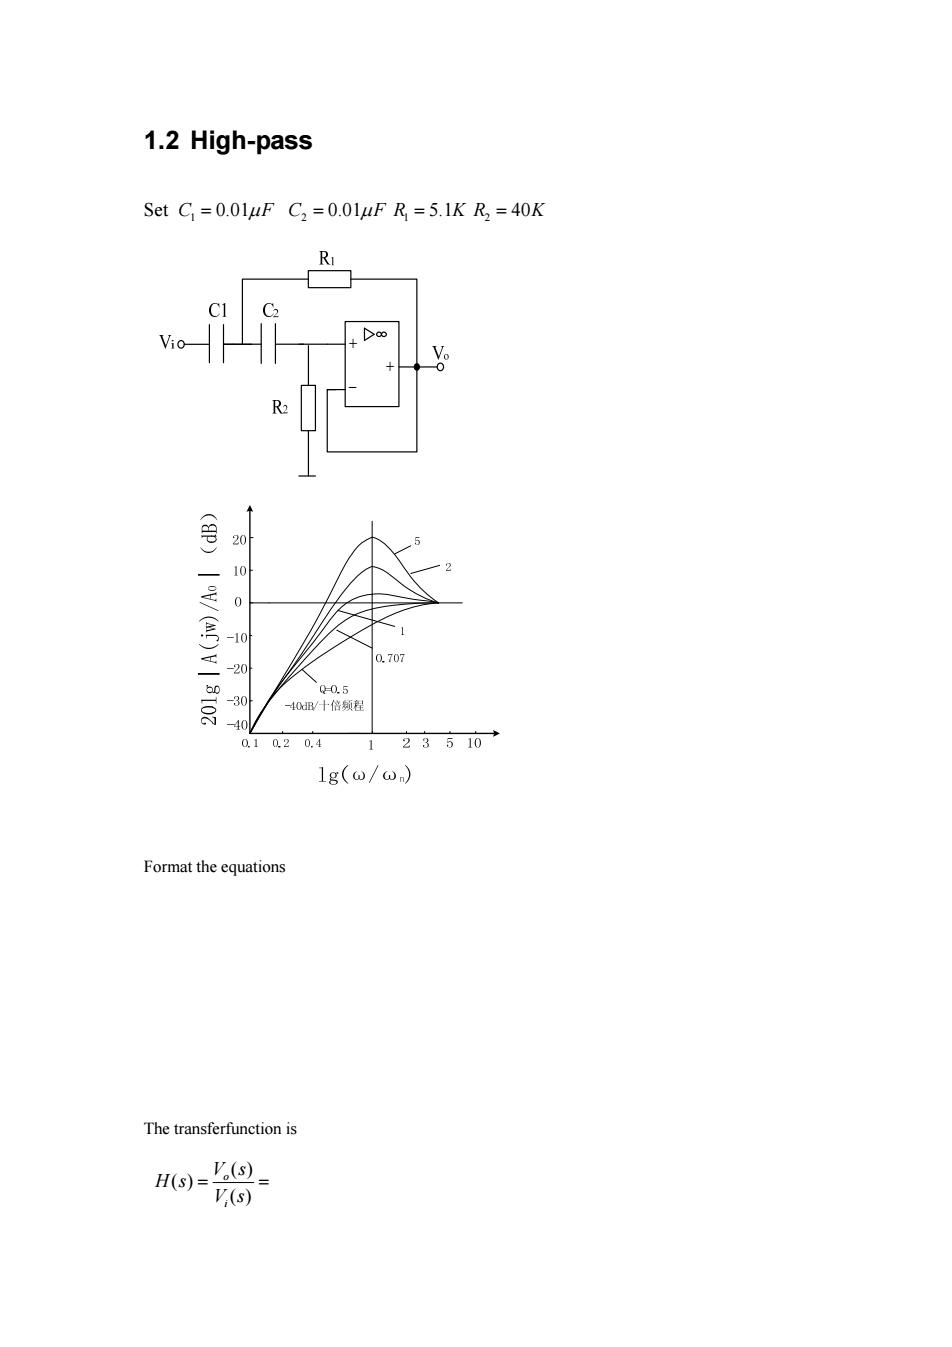
1.2 High-pass Set C =0.01uF C2=0.01uF R =5.1K R3=40K R (p)V/(A)V 8107 010 0 10 8 0.707 Q-0.5 40B/十倍频程 0.10.20.4 1 23510→ 1g(0/0) Format the equations The transferfunction is H(S)= V(= '(s)
1.2 High-pass Set 1 C F 0.01 2 C F 0.01 1 R 5.1K 2 R 40K Format the equations The transferfunction is ( ) ( ) ( ) o i V s H s V s
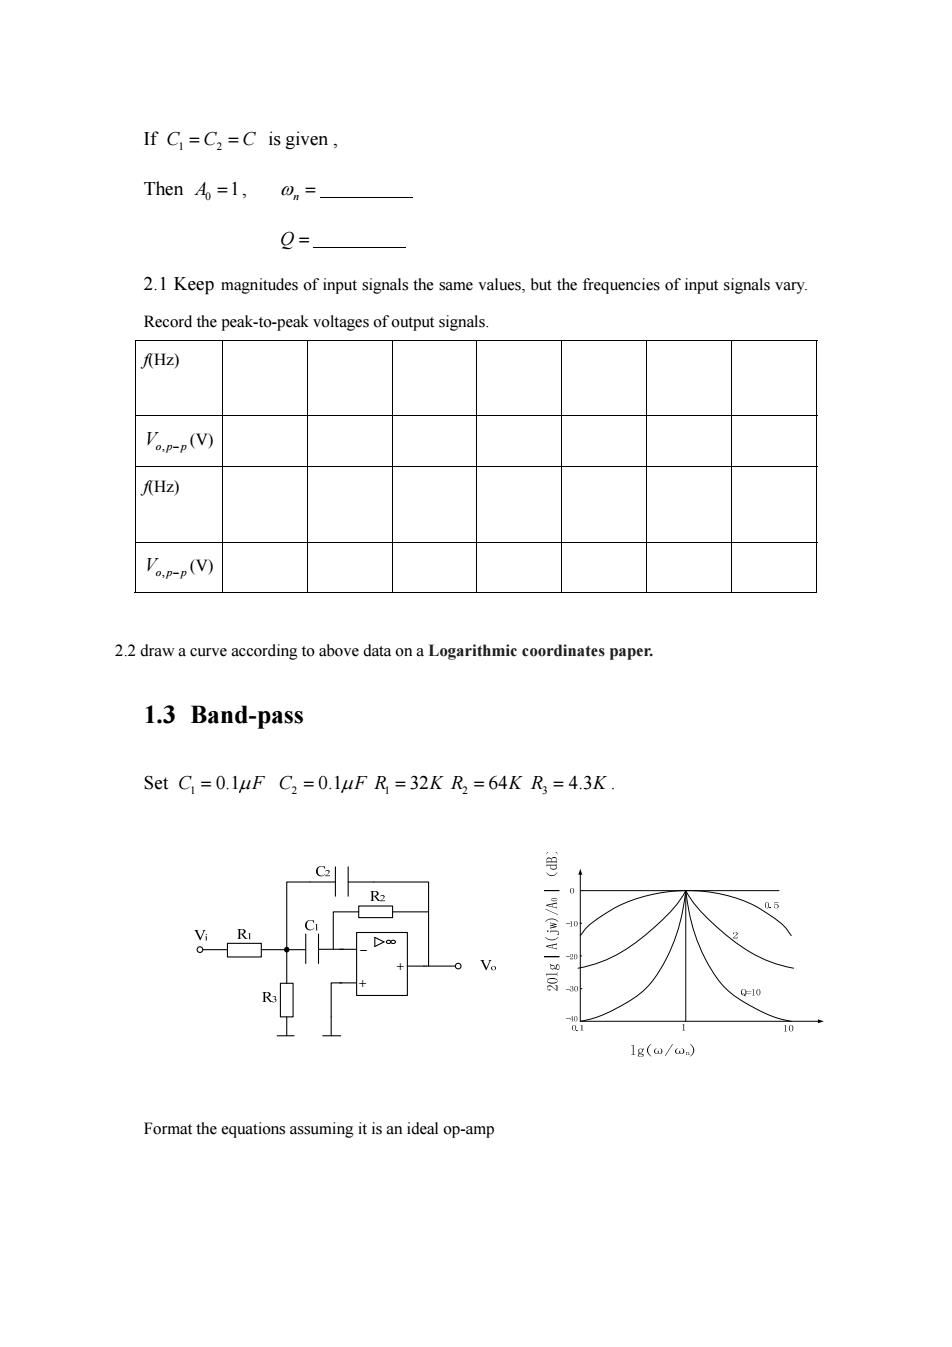
If C=C2=C is given, Then Ao=1, 0= 2.1 Keep magnitudes of input signals the same values,but the frequencies of input signals vary. Record the peak-to-peak voltages of output signals. Hz) V(V) AHz) (V) 2.2 draw a curve according to above data on a Logarithmic coordinates paper. 1.3 Band-pass Set C =0.1uF C,=0.1uF R =32K R =64K R3 =4.3K. =10 10 1g(@/0) Format the equations assuming it is an ideal op-amp
If CCC 1 2 is given , Then 0 A 1, n Q 2.1 Keep magnitudes of input signals the same values, but the frequencies of input signals vary. Record the peak-to-peak voltages of output signals. f(Hz) Vop p , (V) f(Hz) Vop p , (V) 2.2 draw a curve according to above data on a Logarithmic coordinates paper. 1.3 Band-pass Set 1 C F 0.1 2 C F 0.1 1 R 32K 2 R 64K R3 4.3K . Format the equations assuming it is an ideal op-amp
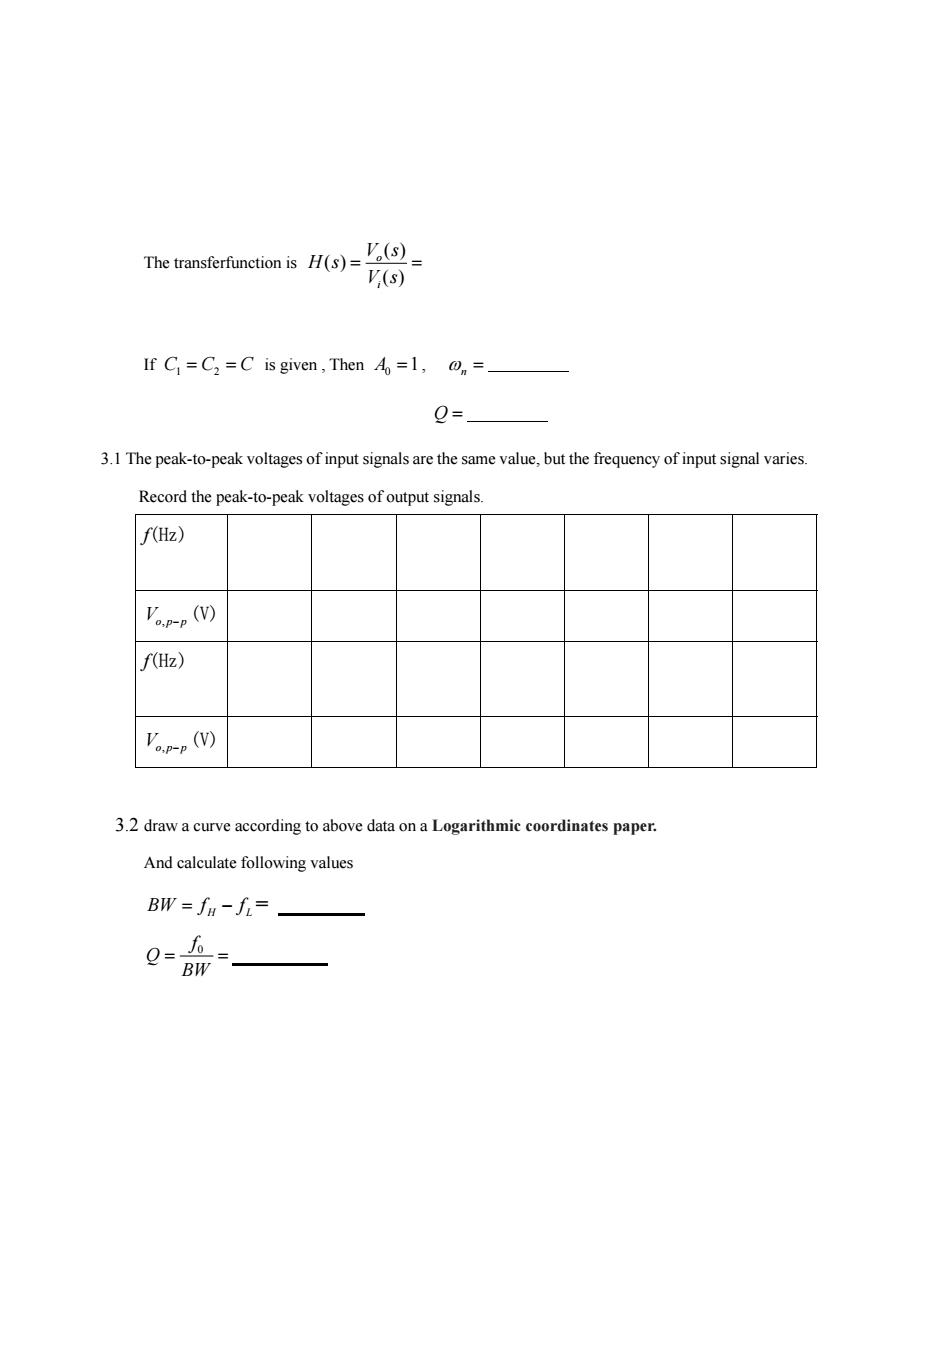
The transferfunction is H(s)= V.(s)= '(s) If C=C,=C is given,Then A=1,= O=_ 3.1 The peak-to-peak voltages of input signals are the same value,but the frequency of input signal varies. Record the peak-to-peak voltages of output signals f(Hz) 'ap-p(M f(Hz) Vp(V) 3.2 draw a curve according to above data on a Logarithmic coordinates paper. And calculate following values BW=fa-f=一
The transferfunction is ( ) ( ) ( ) o i V s H s V s If CCC 1 2 is given , Then 0 A 1, n Q 3.1 The peak-to-peak voltages of input signals are the same value, but the frequency of input signal varies. Record the peak-to-peak voltages of output signals. f(Hz) Vop p , (V) f(Hz) Vop p , (V) 3.2 draw a curve according to above data on a Logarithmic coordinates paper. And calculate following values BWf f H L = 0f Q BW

2 Lab 8 Function Generator 2.1 Sinusoidal signal generator R33K2C10.01uF o Vo 0.0luFC RW 10K2 R 33K 10K910K2 10K (a) R 33K9 C0.0luF oVo 0.0luFC Rw 10K2 R 33K R 10K210K 10K2 D2 (b) Step 1:adjust Ry to start oscillation while unloaded in Fig.(a). Step 2:Then do not change Ry any more. FIG(a) FIG(b) V(peak-to-peak,unloaded) V(peak-to-peak,Loaded with frequency (Hz)
2 Lab 8 Function Generator 2.1 Sinusoidal signal generator Step 1:adjust RW to start oscillation while unloaded in Fig.(a). Step 2: Then do not change RW any more. FIG.(a) FIG.(b) Vo (peak-to-peak,unloaded) Vo (peak-to-peak, Loaded with 1k frequency(Hz)
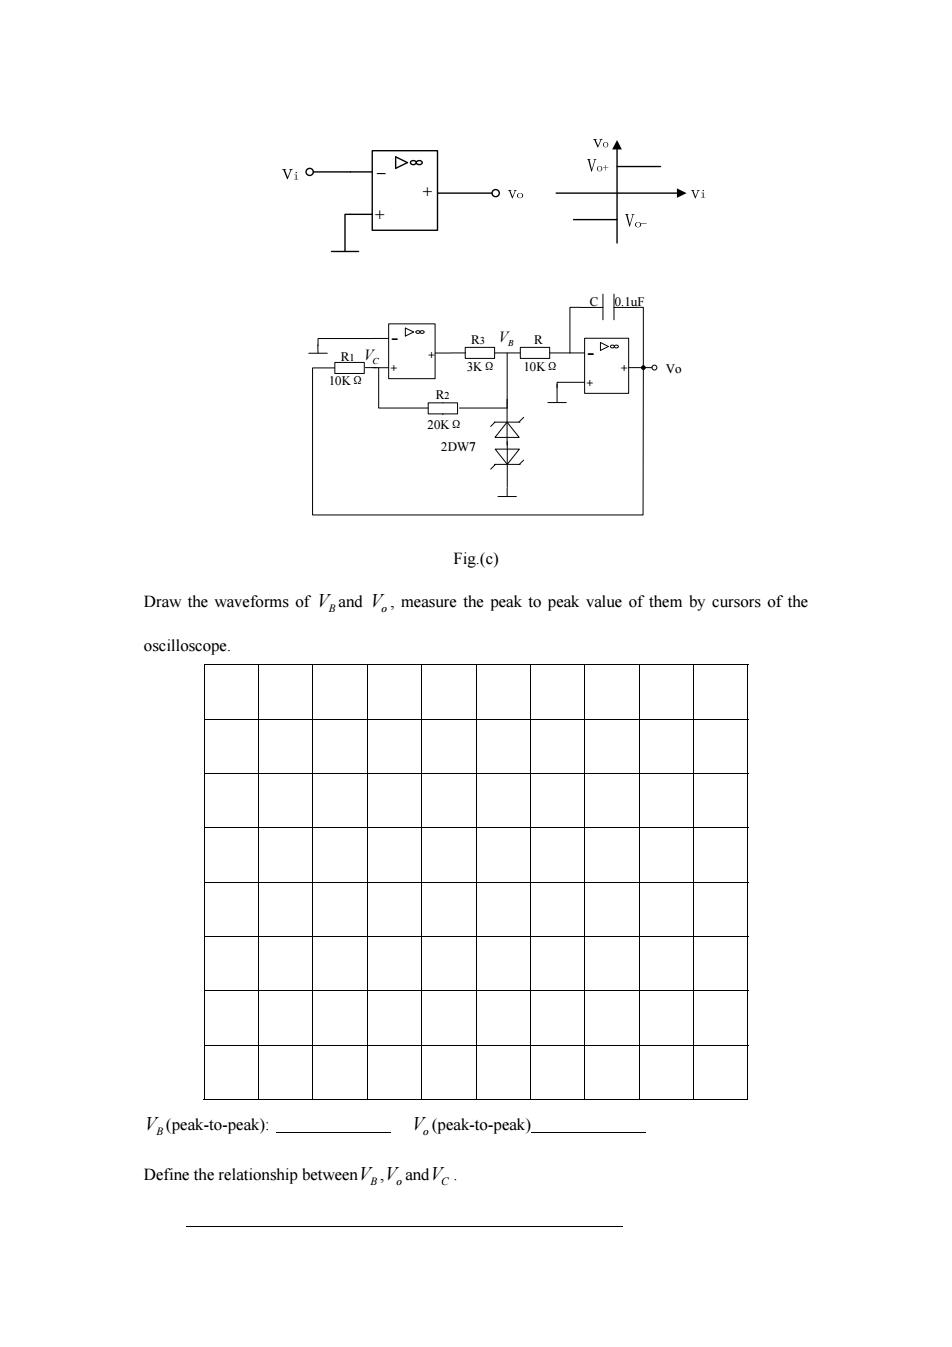
Vo◆ Vot C 0.luF R3 Va R RI V 3KQ 10KQ 0 Vo 10K2 R2 20KQ 2DW7 Fig.(c) Draw the waveforms of Veand V,measure the peak to peak value of them by cursors of the oscilloscope Va(peak-to-peak): V(peak-to-peak). Define the relationship betweenand
Vo 2DW7 R2 20KΩ R3 3KΩ 10KΩ R R1 10KΩ C 0.1uF VB VC Fig.(c) Draw the waveforms of VB and Vo , measure the peak to peak value of them by cursors of the oscilloscope. VB (peak-to-peak): Vo (peak-to-peak) Define the relationship betweenVB ,Vo andVC