正在加载图片...
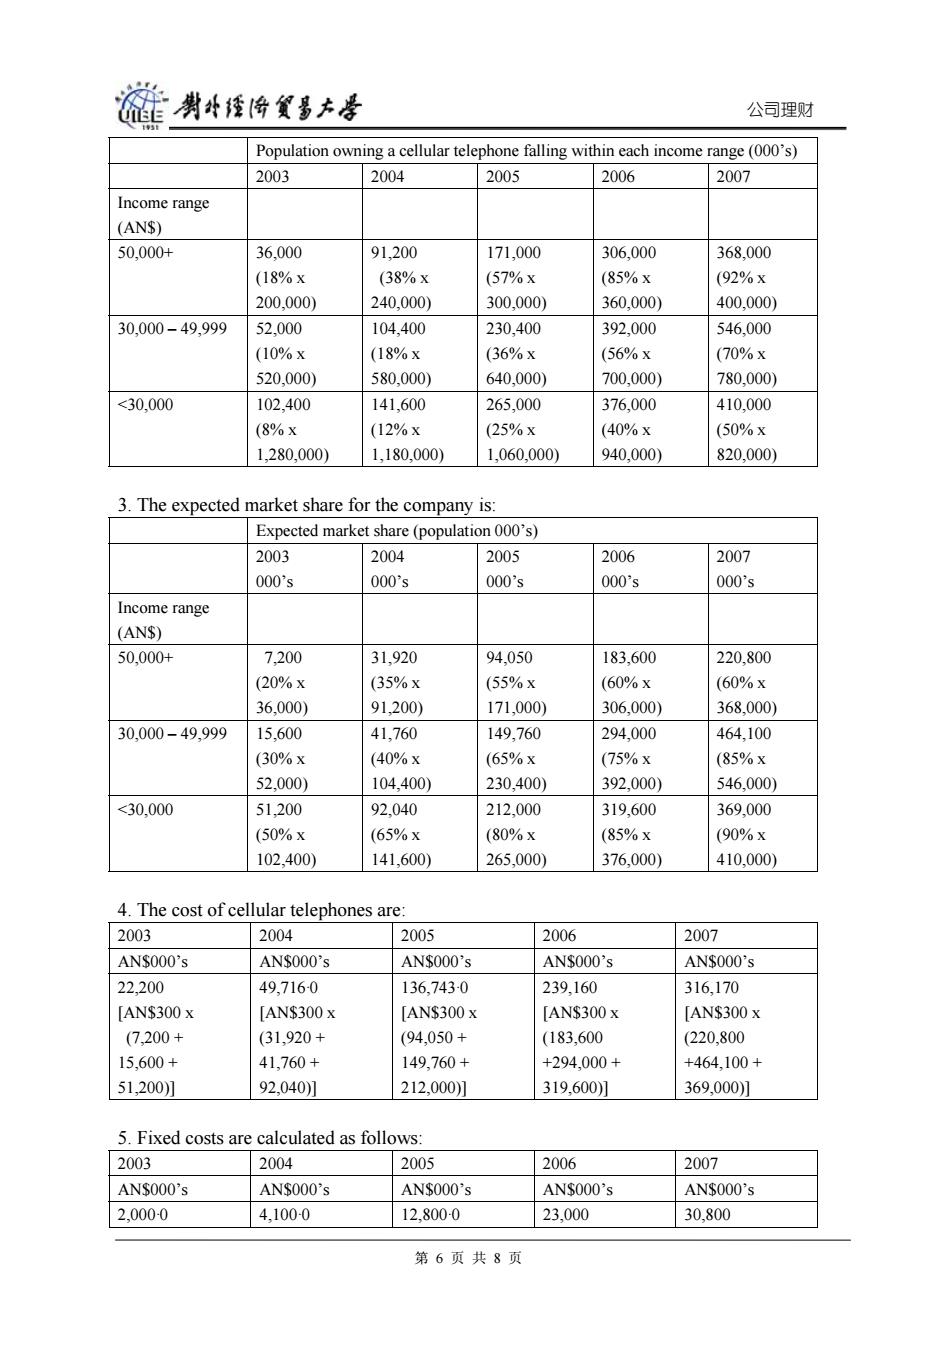
链勇牛经将贸多本圣 公司理财 Population owning a cellular telephone falling within each income range(000's) 2003 2004 2005 2006 2007 Income range (AN$) 50,000+ 36.000 91.200 171.000 306.000 368.000 (18%x (38%x (57%x (85%x (92%x 200.000) 240.000) 300,000) 360.000) 400.000) 30.000-49.999 52.000 104.400 230,400 392,000 546,000 (10%x (18%x (36%x (56%X (70%x 520,000) 580,000) 640.000) 700,000) 780,000) <30.000 102.400 141.600 265.000 376,000 410.000 (8%x (12%x (25%x (40%x (50%x 1.280.000) 1,180,000) 1,060,000) 940,000) 820,000) 3.The expected market share for the company is: Expected market share(population 000's) 2003 2004 2005 2006 2007 000's 000's 000's 000's 000's Income range (AN$) 50,000+ 7.200 31920 94.050 183.600 220,800 (20%x (35%x (55%x (60%x (60%x 36,000) 91,200) 171,000) 306,000) 368,000) 30.000-49.999 15.600 41.760 149.760 294.000 464.100 (30%X (40%x (65%x (75%x (85%x 52,000) 104,400) 230,400) 392,000) 546,000) <30.000 51.200 92.040 212.000 319.600 369.000 (50%X (65%x (80%x (85%x (90%x 102.400) 141.600) 265.000) 376,000) 410,000) 4.The cost of cellular telephones are: 2003 2004 2005 2006 2007 AN$000's AN$000's AN$000's AN$000's AN$000's 22,200 49.716-0 136.743-0 239.160 316.170 [AN$300x [AN$300x [AN$300x [AN$300X [AN$300x (7,200+ (31,920+ (94,050+ (183,600 (220.800 15,600+ 41,760+ 149,760+ +294.000+ +464.100+ 51,200] 92,040)] 212,000)] 319,600)] 369,000)] 5.Fixed costs are calculated as follows: 2003 2004 2005 2006 2007 AN$000's AN$000's AN$000's AN$000's AN$000's 2,0000 4.100-0 12.800-0 23,000 30,800 第6页共8页公司理财 Population owning a cellular telephone falling within each income range (000’s) 2003 2004 2005 2006 2007 Income range (AN$) 50,000+ 36,000 (18% x 200,000) 91,200 (38% x 240,000) 171,000 (57% x 300,000) 306,000 (85% x 360,000) 368,000 (92% x 400,000) 30,000 – 49,999 52,000 (10% x 520,000) 104,400 (18% x 580,000) 230,400 (36% x 640,000) 392,000 (56% x 700,000) 546,000 (70% x 780,000) <30,000 102,400 (8% x 1,280,000) 141,600 (12% x 1,180,000) 265,000 (25% x 1,060,000) 376,000 (40% x 940,000) 410,000 (50% x 820,000) 3. The expected market share for the company is: Expected market share (population 000’s) 2003 000’s 2004 000’s 2005 000’s 2006 000’s 2007 000’s Income range (AN$) 50,000+ 7,200 (20% x 36,000) 31,920 (35% x 91,200) 94,050 (55% x 171,000) 183,600 (60% x 306,000) 220,800 (60% x 368,000) 30,000 – 49,999 15,600 (30% x 52,000) 41,760 (40% x 104,400) 149,760 (65% x 230,400) 294,000 (75% x 392,000) 464,100 (85% x 546,000) <30,000 51,200 (50% x 102,400) 92,040 (65% x 141,600) 212,000 (80% x 265,000) 319,600 (85% x 376,000) 369,000 (90% x 410,000) 4. The cost of cellular telephones are: 2003 2004 2005 2006 2007 AN$000’s AN$000’s AN$000’s AN$000’s AN$000’s 22,200 [AN$300 x (7,200 + 15,600 + 51,200)] 49,716·0 [AN$300 x (31,920 + 41,760 + 92,040)] 136,743·0 [AN$300 x (94,050 + 149,760 + 212,000)] 239,160 [AN$300 x (183,600 +294,000 + 319,600)] 316,170 [AN$300 x (220,800 +464,100 + 369,000)] 5. Fixed costs are calculated as follows: 2003 2004 2005 2006 2007 AN$000’s AN$000’s AN$000’s AN$000’s AN$000’s 2,000·0 4,100·0 12,800·0 23,000 30,800 第 6 页 共 8 页