正在加载图片...

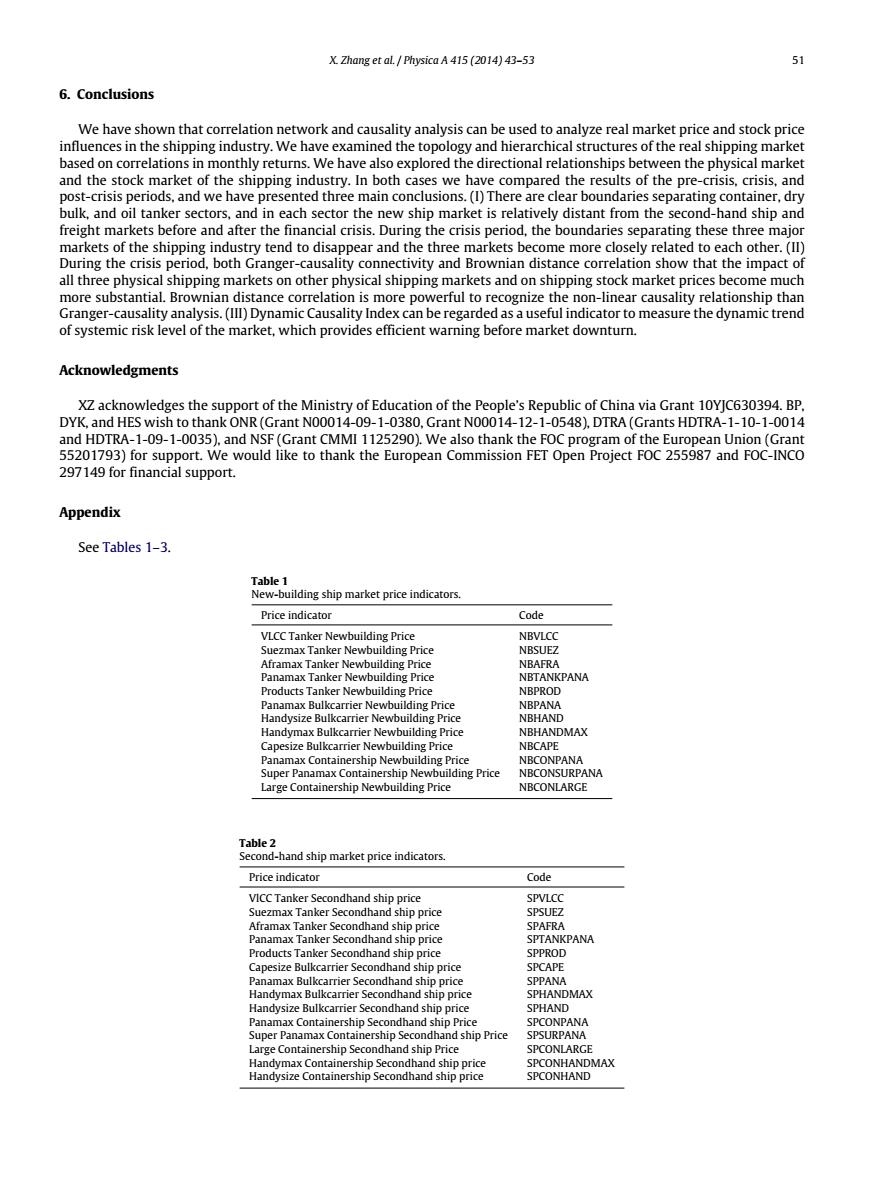
X.Zhang et al.Physica A 415 (2014)43-53 51 6.Conclusions We have shown that correlation network and causality analysis can be used to analyze real market price and stock price influences in the shipping industry.We have examined the topology and hierarchical structures of the real shipping market based on correlations in monthly returns.We have also explored the directional relationships between the physical market and the stock market of the shipping industry.In both cases we have compared the results of the pre-crisis,crisis,and post-crisis periods,and we have presented three main conclusions.(I)There are clear boundaries separating container,dry bulk,and oil tanker sectors,and in each sector the new ship market is relatively distant from the second-hand ship and freight markets before and after the financial crisis.During the crisis period,the boundaries separating these three major markets of the shipping industry tend to disappear and the three markets become more closely related to each other.(II) During the crisis period,both Granger-causality connectivity and Brownian distance correlation show that the impact of all three physical shipping markets on other physical shipping markets and on shipping stock market prices become much more substantial.Brownian distance correlation is more powerful to recognize the non-linear causality relationship than Granger-causality analysis.(IIl)Dynamic Causality Index can be regarded as a useful indicator to measure the dynamic trend of systemic risk level of the market,which provides efficient warning before market downturn. Acknowledgments XZ acknowledges the support of the Ministry of Education of the People's Republic of China via Grant 10YJC630394.BP. DYK,and HES wish to thank ONR(Grant N00014-09-1-0380,Grant N00014-12-1-0548),DTRA(Grants HDTRA-1-10-1-0014 and HDTRA-1-09-1-0035),and NSF(Grant CMMI 1125290).We also thank the FOC program of the European Union(Grant 55201793)for support.We would like to thank the European Commission FET Open Project FOC 255987 and FOC-INCO 297149 for financial support. Appendix See Tables 1-3. Table 1 New-building ship market price indicators. Price indicator Code VLCC Tanker Newbuilding Price NBVLCC Suezmax Tanker Newbuilding Price NBSUEZ Aframax Tanker Newbuilding Price NBAFRA Panamax Tanker Newbuilding Price NBTANKPANA Products Tanker Newbuilding Price NBPROD Panamax Bulkcarrier Newbuilding Price NBPANA Handysize Bulkcarrier Newbuilding Price NBHAND Handymax Bulkcarrier Newbuilding Price NBHANDMAX Capesize Bulkcarrier Newbuilding Price NBCAPE Panamax Containership Newbuilding Price NBCONPANA Super Panamax Containership Newbuilding Price NBCONSURPANA Large Containership Newbuilding Price NBCONLARGE Table 2 Second-hand ship market price indicators. Price indicator Code VICC Tanker Secondhand ship price SPVLCC Suezmax Tanker Secondhand ship price SPSUEZ Aframax Tanker Secondhand ship price SPAFRA Panamax Tanker Secondhand ship price SPTANKPANA Products Tanker Secondhand ship price SPPROD Capesize Bulkcarrier Secondhand ship price SPCAPE Panamax Bulkcarrier Secondhand ship price SPPANA Handymax Bulkcarrier Secondhand ship price SPHANDMAX Handysize Bulkcarrier Secondhand ship price SPHAND Panamax Containership Secondhand ship Price SPCONPANA Super Panamax Containership Secondhand ship Price SPSURPANA Large Containership Secondhand ship Price SPCONLARGE Handymax Containership Secondhand ship price SPCONHANDMAX Handysize Containership Secondhand ship price SPCONHANDX. Zhang et al. / Physica A 415 (2014) 43–53 51 6. Conclusions We have shown that correlation network and causality analysis can be used to analyze real market price and stock price influences in the shipping industry. We have examined the topology and hierarchical structures of the real shipping market based on correlations in monthly returns. We have also explored the directional relationships between the physical market and the stock market of the shipping industry. In both cases we have compared the results of the pre-crisis, crisis, and post-crisis periods, and we have presented three main conclusions. (I) There are clear boundaries separating container, dry bulk, and oil tanker sectors, and in each sector the new ship market is relatively distant from the second-hand ship and freight markets before and after the financial crisis. During the crisis period, the boundaries separating these three major markets of the shipping industry tend to disappear and the three markets become more closely related to each other. (II) During the crisis period, both Granger-causality connectivity and Brownian distance correlation show that the impact of all three physical shipping markets on other physical shipping markets and on shipping stock market prices become much more substantial. Brownian distance correlation is more powerful to recognize the non-linear causality relationship than Granger-causality analysis. (III) Dynamic Causality Index can be regarded as a useful indicator to measure the dynamic trend of systemic risk level of the market, which provides efficient warning before market downturn. Acknowledgments XZ acknowledges the support of the Ministry of Education of the People’s Republic of China via Grant 10YJC630394. BP, DYK, and HES wish to thank ONR (Grant N00014-09-1-0380, Grant N00014-12-1-0548), DTRA (Grants HDTRA-1-10-1-0014 and HDTRA-1-09-1-0035), and NSF (Grant CMMI 1125290). We also thank the FOC program of the European Union (Grant 55201793) for support. We would like to thank the European Commission FET Open Project FOC 255987 and FOC-INCO 297149 for financial support. Appendix See Tables 1–3. Table 1 New-building ship market price indicators. Price indicator Code VLCC Tanker Newbuilding Price NBVLCC Suezmax Tanker Newbuilding Price NBSUEZ Aframax Tanker Newbuilding Price NBAFRA Panamax Tanker Newbuilding Price NBTANKPANA Products Tanker Newbuilding Price NBPROD Panamax Bulkcarrier Newbuilding Price NBPANA Handysize Bulkcarrier Newbuilding Price NBHAND Handymax Bulkcarrier Newbuilding Price NBHANDMAX Capesize Bulkcarrier Newbuilding Price NBCAPE Panamax Containership Newbuilding Price NBCONPANA Super Panamax Containership Newbuilding Price NBCONSURPANA Large Containership Newbuilding Price NBCONLARGE Table 2 Second-hand ship market price indicators. Price indicator Code VlCC Tanker Secondhand ship price SPVLCC Suezmax Tanker Secondhand ship price SPSUEZ Aframax Tanker Secondhand ship price SPAFRA Panamax Tanker Secondhand ship price SPTANKPANA Products Tanker Secondhand ship price SPPROD Capesize Bulkcarrier Secondhand ship price SPCAPE Panamax Bulkcarrier Secondhand ship price SPPANA Handymax Bulkcarrier Secondhand ship price SPHANDMAX Handysize Bulkcarrier Secondhand ship price SPHAND Panamax Containership Secondhand ship Price SPCONPANA Super Panamax Containership Secondhand ship Price SPSURPANA Large Containership Secondhand ship Price SPCONLARGE Handymax Containership Secondhand ship price SPCONHANDMAX Handysize Containership Secondhand ship price SPCONHAND