正在加载图片...
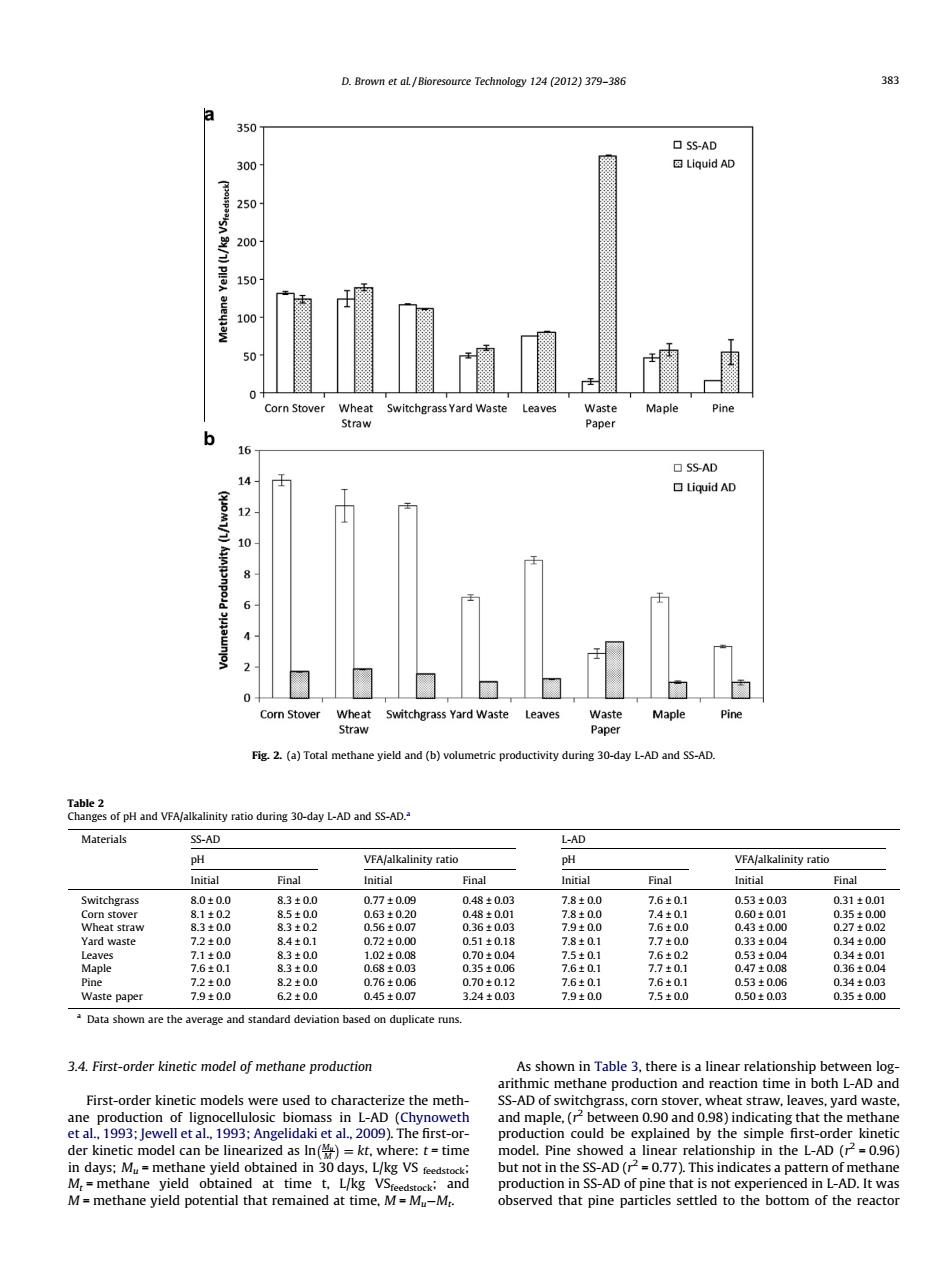
D.Brown et al/Bioresource Technology 124(2012)379-386 383 a 350 口SS-AD 300 ☒Liquid AD 250 200 150 100 50 Corn Stover Wheat Switchgrass Yard Waste Leaves Waste Maple Pine Straw Paper b 16 OSS-AD 14 Liquid AD 10 8 Corn Stover Wheat Switchgrass Yard Waste Leaves Waste Maple Pine Straw Paper Fig.2.(a)Total methane yield and(b)volumetric productivity during 30-day L-AD and SS-AD. Table 2 Changes of pH and VFA/alkalinity ratio during 30-day L-AD and SS-AD. Materials SS-AD L-AD pH VFA/alkalinity ratio pH VFA/alkalinity ratio Initial Final Initial Final Initial Final Initial Final Switchgrass 8.0±0.0 8.3±0.0 0.77±0.09 0.48±0.03 7.8±0.0 7.6±0.1 0.53±0.03 0.31±0.01 Corn stover 8.1±0.2 8.5±0.0 0.63±020 0.48±0.01 7.8±0.0 7.4±0.1 0.60±0.01 0.35±0.00 Wheat straw 8.3±0.0 8.3±02 0.56±0.07 0.36±0.03 7.9±0.0 7.6±0.0 0.43±0.00 0.27±0.02 Yard waste 7.2±0.0 8.4±0.1 072±0.00 051±0.18 7.8±0.1 7.7±0.0 0.33±004 034±000 Leaves 7.1±0.0 8.3±0.0 1.02±0.08 0.70±0.04 7.5±0.1 7.6±0.2 0.53±0.04 0.34±0.01 Maple 7.6±0.1 8.3±0.0 0.68±0.03 0.35±0.06 7.6±0.1 7.7±0.1 0.47±0.08 0.36±0.04 Pine 7.2±0.0 82±0.0 0.76±0.06 0.70±0.12 7.6±0.1 7.6±0.1 0.53±0.06 0.34±0.03 Waste paper 7.9±0.0 6.2±0.0 0.45±0.07 3.24±0.03 7.9±0.0 7.5±0.0 0.50±0.03 0.35±0.00 a Data shown are the average and standard deviation based on duplicate runs. 3.4.First-order kinetic model of methane production As shown in Table 3,there is a linear relationship between log- arithmic methane production and reaction time in both L-AD and First-order kinetic models were used to characterize the meth- SS-AD of switchgrass,corn stover,wheat straw,leaves,yard waste, ane production of lignocellulosic biomass in L-AD (Chynoweth and maple,(r between 0.90 and 0.98)indicating that the methane et al.,1993:Jewell et al.,1993;Angelidaki et al.,2009).The first-or- production could be explained by the simple first-order kinetic der kinetic model can be linearized as In()=kt.where:t=time model.Pine showed a linear relationship in the L-AD(r=0.96) in days:Mu=methane yield obtained in 30 days,L/kg VS feedstock: but not in the SS-AD(r=0.77).This indicates a pattern of methane M=methane yield obtained at time t.L/kg VSreedstock:and production in SS-AD of pine that is not experienced in L-AD.It was M=methane yield potential that remained at time,M=Mu-Mr. observed that pine particles settled to the bottom of the reactor3.4. First-order kinetic model of methane production First-order kinetic models were used to characterize the methane production of lignocellulosic biomass in L-AD (Chynoweth et al., 1993; Jewell et al., 1993; Angelidaki et al., 2009). The first-order kinetic model can be linearized as ln Mu M ¼ kt, where: t = time in days; Mu = methane yield obtained in 30 days, L/kg VS feedstock; Mt = methane yield obtained at time t, L/kg VSfeedstock; and M = methane yield potential that remained at time, M = MuMt. As shown in Table 3, there is a linear relationship between logarithmic methane production and reaction time in both L-AD and SS-AD of switchgrass, corn stover, wheat straw, leaves, yard waste, and maple, (r 2 between 0.90 and 0.98) indicating that the methane production could be explained by the simple first-order kinetic model. Pine showed a linear relationship in the L-AD (r 2 = 0.96) but not in the SS-AD (r 2 = 0.77). This indicates a pattern of methane production in SS-AD of pine that is not experienced in L-AD. It was observed that pine particles settled to the bottom of the reactor Fig. 2. (a) Total methane yield and (b) volumetric productivity during 30-day L-AD and SS-AD. Table 2 Changes of pH and VFA/alkalinity ratio during 30-day L-AD and SS-AD.a Materials SS-AD L-AD pH VFA/alkalinity ratio pH VFA/alkalinity ratio Initial Final Initial Final Initial Final Initial Final Switchgrass 8.0 ± 0.0 8.3 ± 0.0 0.77 ± 0.09 0.48 ± 0.03 7.8 ± 0.0 7.6 ± 0.1 0.53 ± 0.03 0.31 ± 0.01 Corn stover 8.1 ± 0.2 8.5 ± 0.0 0.63 ± 0.20 0.48 ± 0.01 7.8 ± 0.0 7.4 ± 0.1 0.60 ± 0.01 0.35 ± 0.00 Wheat straw 8.3 ± 0.0 8.3 ± 0.2 0.56 ± 0.07 0.36 ± 0.03 7.9 ± 0.0 7.6 ± 0.0 0.43 ± 0.00 0.27 ± 0.02 Yard waste 7.2 ± 0.0 8.4 ± 0.1 0.72 ± 0.00 0.51 ± 0.18 7.8 ± 0.1 7.7 ± 0.0 0.33 ± 0.04 0.34 ± 0.00 Leaves 7.1 ± 0.0 8.3 ± 0.0 1.02 ± 0.08 0.70 ± 0.04 7.5 ± 0.1 7.6 ± 0.2 0.53 ± 0.04 0.34 ± 0.01 Maple 7.6 ± 0.1 8.3 ± 0.0 0.68 ± 0.03 0.35 ± 0.06 7.6 ± 0.1 7.7 ± 0.1 0.47 ± 0.08 0.36 ± 0.04 Pine 7.2 ± 0.0 8.2 ± 0.0 0.76 ± 0.06 0.70 ± 0.12 7.6 ± 0.1 7.6 ± 0.1 0.53 ± 0.06 0.34 ± 0.03 Waste paper 7.9 ± 0.0 6.2 ± 0.0 0.45 ± 0.07 3.24 ± 0.03 7.9 ± 0.0 7.5 ± 0.0 0.50 ± 0.03 0.35 ± 0.00 a Data shown are the average and standard deviation based on duplicate runs. D. Brown et al. / Bioresource Technology 124 (2012) 379–386 383���