正在加载图片...
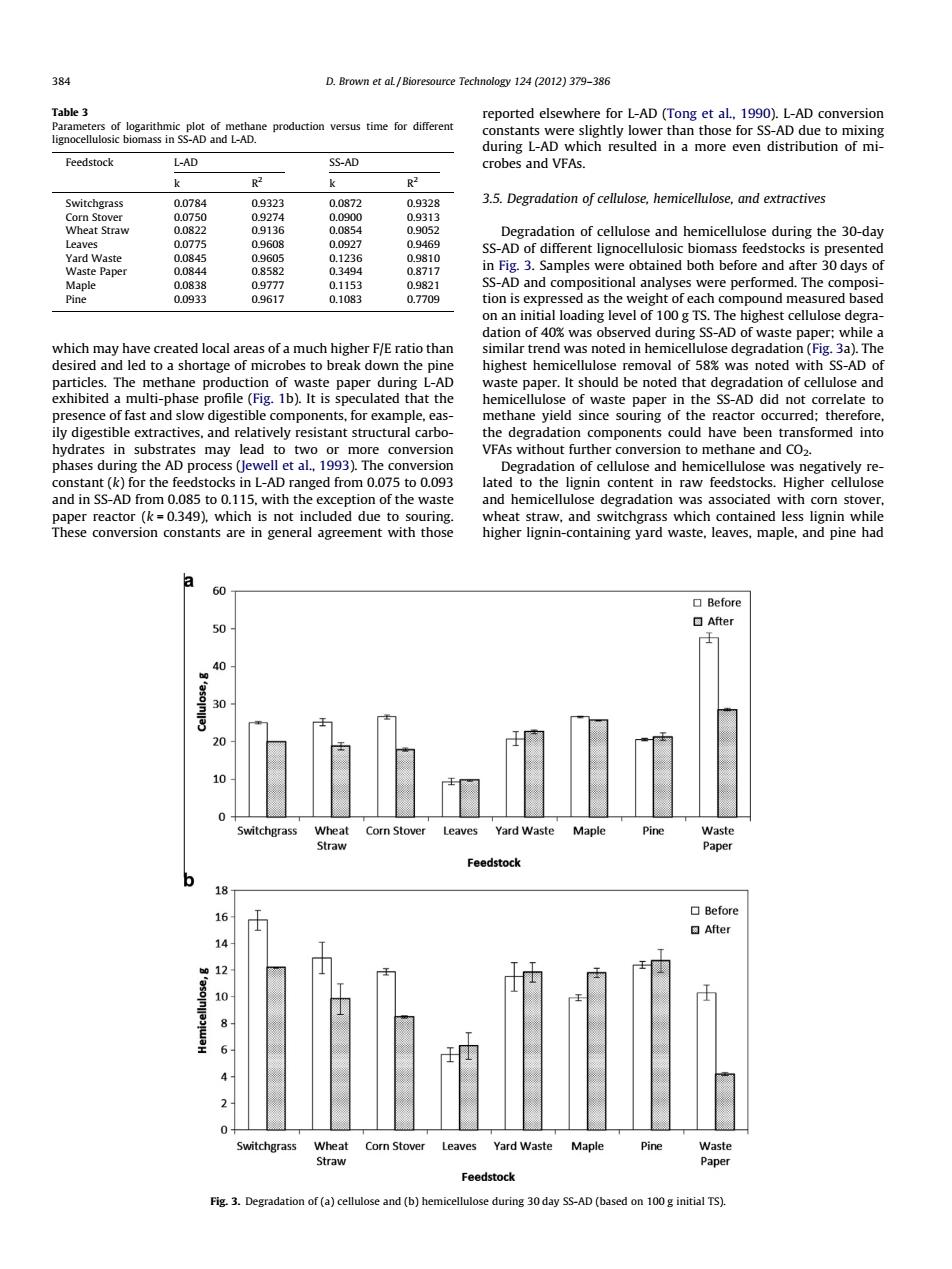
384 D.Brown et aL/Bioresource Technology 124(2012)379-386 Table 3 reported elsewhere for L-AD(Tong et al,1990).L-AD conversion Parameters of logarithmic plot of methane production versus time for different lignocellulosic biomass in SS-AD and L-AD. constants were slightly lower than those for SS-AD due to mixing during L-AD which resulted in a more even distribution of mi- Feedstock L-AD SS-AD crobes and VFAs. k R2 k R2 Switchgrass 0.0784 0.9323 0.0872 0.9328 3.5.Degradation of cellulose,hemicellulose,and extractives Corn Stover 0.0750 09274 0.0900 0.9313 Wheat Straw 0.0822 0.9136 0.0854 0.9052 Degradation of cellulose and hemicellulose during the 30-day Leaves 0.0775 09608 0.0927 0.9469 SS-AD of different lignocellulosic biomass feedstocks is presented Yard Waste 0.0845 0.9605 0.1236 0.9810 Waste Paper 0.0844 08582 03494 0.8717 in Fig.3.Samples were obtained both before and after 30 days of Maple 0.0838 0.9777 0.1153 0.9821 SS-AD and compositional analyses were performed.The composi- Pine 0.0933 0.9617 0.1083 0.7709 tion is expressed as the weight of each compound measured based on an initial loading level of 100g TS.The highest cellulose degra- dation of 40%was observed during SS-AD of waste paper:while a which may have created local areas of a much higher F/E ratio than similar trend was noted in hemicellulose degradation(Fig.3a).The desired and led to a shortage of microbes to break down the pine highest hemicellulose removal of 58%was noted with SS-AD of particles.The methane production of waste paper during L-AD waste paper.It should be noted that degradation of cellulose and exhibited a multi-phase profile(Fig.1b).It is speculated that the hemicellulose of waste paper in the SS-AD did not correlate to presence of fast and slow digestible components,for example,eas- methane yield since souring of the reactor occurred;therefore, ily digestible extractives,and relatively resistant structural carbo- the degradation components could have been transformed into hydrates in substrates may lead to two or more conversion VFAs without further conversion to methane and CO2. phases during the AD process (Jewell et al.,1993).The conversion Degradation of cellulose and hemicellulose was negatively re- constant (k)for the feedstocks in L-AD ranged from 0.075 to 0.093 lated to the lignin content in raw feedstocks.Higher cellulose and in SS-AD from 0.085 to 0.115,with the exception of the waste and hemicellulose degradation was associated with corn stover. paper reactor(k=0.349),which is not included due to souring. wheat straw,and switchgrass which contained less lignin while These conversion constants are in general agreement with those higher lignin-containing yard waste,leaves,maple,and pine had ④ 60 ▣Before 50 ▣After 40 30 20 10 Switchgrass Wheat Corn Stover Leaves Yard Waste Maple Waste Straw Paper Feedstock 18 16 ▣Before After 14 12 10 2 0+ Switchgrass Wheat Corn Stover Leaves Yard Waste Maple Pine Waste Straw Paper Feedstock Fig.3.Degradation of(a)cellulose and(b)hemicellulose during 30 day SS-AD (based on 100 g initial TS).which may have created local areas of a much higher F/E ratio than desired and led to a shortage of microbes to break down the pine particles. The methane production of waste paper during L-AD exhibited a multi-phase profile (Fig. 1b). It is speculated that the presence of fast and slow digestible components, for example, easily digestible extractives, and relatively resistant structural carbohydrates in substrates may lead to two or more conversion phases during the AD process (Jewell et al., 1993). The conversion constant (k) for the feedstocks in L-AD ranged from 0.075 to 0.093 and in SS-AD from 0.085 to 0.115, with the exception of the waste paper reactor (k = 0.349), which is not included due to souring. These conversion constants are in general agreement with those reported elsewhere for L-AD (Tong et al., 1990). L-AD conversion constants were slightly lower than those for SS-AD due to mixing during L-AD which resulted in a more even distribution of microbes and VFAs. 3.5. Degradation of cellulose, hemicellulose, and extractives Degradation of cellulose and hemicellulose during the 30-day SS-AD of different lignocellulosic biomass feedstocks is presented in Fig. 3. Samples were obtained both before and after 30 days of SS-AD and compositional analyses were performed. The composition is expressed as the weight of each compound measured based on an initial loading level of 100 g TS. The highest cellulose degradation of 40% was observed during SS-AD of waste paper; while a similar trend was noted in hemicellulose degradation (Fig. 3a). The highest hemicellulose removal of 58% was noted with SS-AD of waste paper. It should be noted that degradation of cellulose and hemicellulose of waste paper in the SS-AD did not correlate to methane yield since souring of the reactor occurred; therefore, the degradation components could have been transformed into VFAs without further conversion to methane and CO2. Degradation of cellulose and hemicellulose was negatively related to the lignin content in raw feedstocks. Higher cellulose and hemicellulose degradation was associated with corn stover, wheat straw, and switchgrass which contained less lignin while higher lignin-containing yard waste, leaves, maple, and pine had Table 3 Parameters of logarithmic plot of methane production versus time for different lignocellulosic biomass in SS-AD and L-AD. Feedstock L-AD SS-AD k R2 k R2 Switchgrass 0.0784 0.9323 0.0872 0.9328 Corn Stover 0.0750 0.9274 0.0900 0.9313 Wheat Straw 0.0822 0.9136 0.0854 0.9052 Leaves 0.0775 0.9608 0.0927 0.9469 Yard Waste 0.0845 0.9605 0.1236 0.9810 Waste Paper 0.0844 0.8582 0.3494 0.8717 Maple 0.0838 0.9777 0.1153 0.9821 Pine 0.0933 0.9617 0.1083 0.7709 Fig. 3. Degradation of (a) cellulose and (b) hemicellulose during 30 day SS-AD (based on 100 g initial TS). 384 D. Brown et al. / Bioresource Technology 124 (2012) 379–386