正在加载图片...
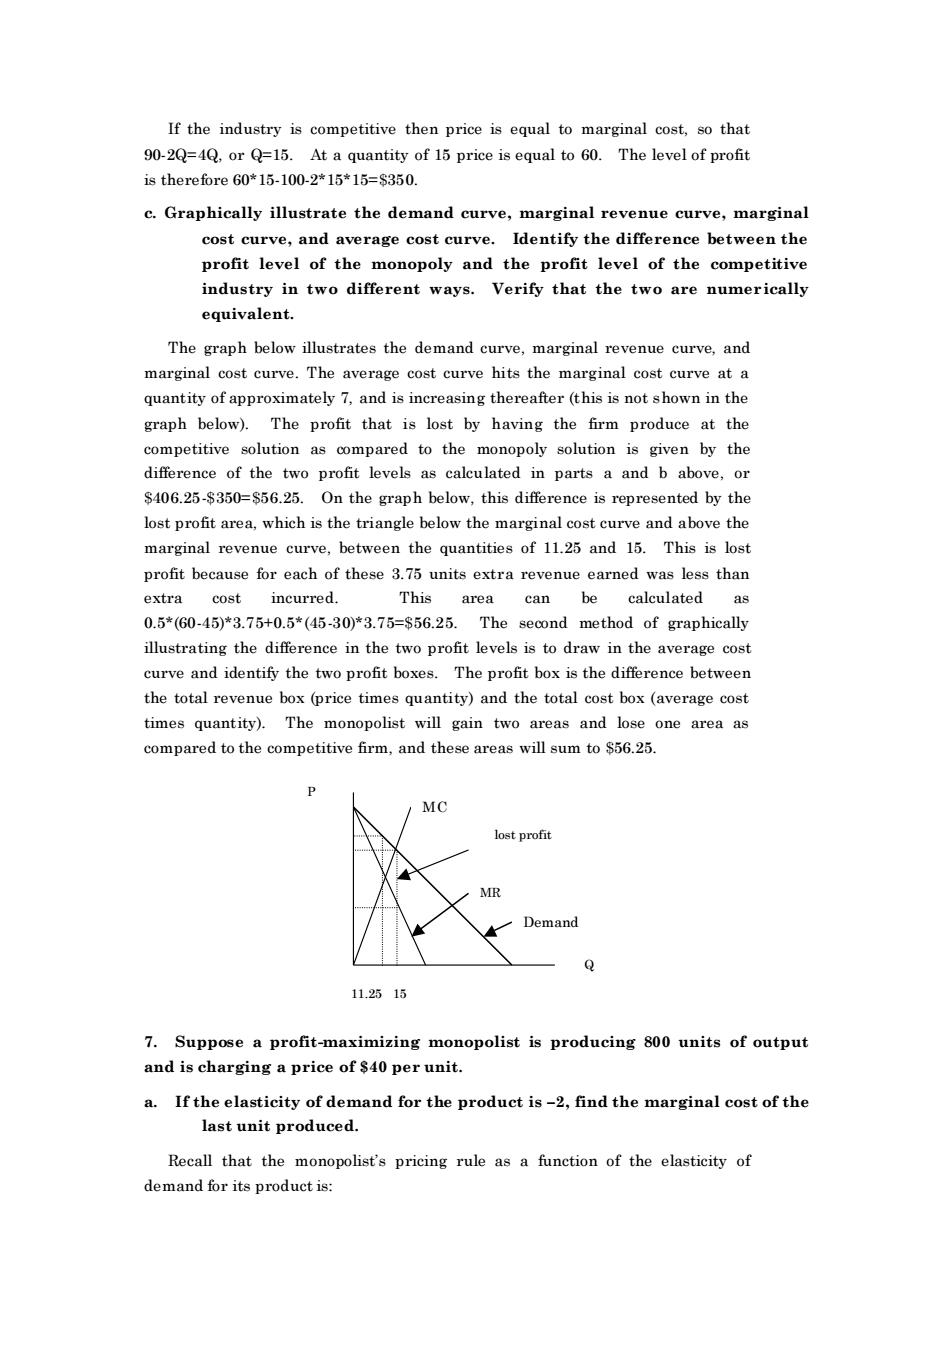
If the industry is competitive then price is equal to marginal cost,so that is therefore60*15-100-2*15*15=$350 e.Graphically illustrate the demand curve,marginal revenue curve,marginal cost curve,and average cost curve.Identify the difference between the profit level of the monopoly and the profit level of the competitive industry in two different ways.Verify that the two are numerically equivalent. The graph below illustrates the demand curve,marginal revenue curve,and marginal.The hita the e marginal cos curve at a quantity of approximately 7,and is increasing thereafter (this is not shown in the graph below).The profit that is lost by having the firm produce at the competitive solution as compared to the monopoly solution is given by the difference of the two profit levels as calculated in parts a and b above,or 406.25-350=56.25.On the graph below,this diffo ented by lost profit area,which is the triangle below the marginal cost curve and above the marginal revenue curve.between the quantities of 11.25 and 15.This is lost profit because for each of these 3.75 units extra revenue earned was less than extra cost incurred. This area can be calculated 0.5*(60-45)*3.75+0.5*(45-30*3.75=s56.25.The ond method of graphically illustrating the difference in the two profit levels is to draw in the average cost curve and identify the two profit boxes.The profit box is the difference between the total revenue box (price times quantity)and the total cost box(average cost times quantity).The monopolist will gain two areas and lose one area as compared to the competitive firm,and these areas will sum to $56.25. loet profit 11.2515 7.Suppose a profit-maximizing monopolist is producing 800 units of output and is charging a price of $40 per unit. a.If the elasticity of demand for the product is-2,find the marginal cost of the last unit produced Recall that the monopolist's pricing rule as a function of the elasticity of demand for its product is If the industry is competitive then price is equal to marginal cost, so that 90-2Q=4Q, or Q=15. At a quantity of 15 price is equal to 60. The level of profit is therefore 60*15-100-2*15*15=$350. c. Graphically illustrate the demand curve, marginal revenue curve, marginal cost curve, and average cost curve. Identify the difference between the profit level of the monopoly and the profit level of the competitive industry in two different ways. Verify that the two are numer ically equivalent. The graph below illustrates the demand curve, marginal revenue curve, and marginal cost curve. The average cost curve hits the marginal cost curve at a quantity of approximately 7, and is increasing thereafter (this is not shown in the graph below). The profit that is lost by having the firm produce at the competitive solution as compared to the monopoly solution is given by the difference of the two profit levels as calculated in parts a and b above, or $406.25-$350=$56.25. On the graph below, this difference is represented by the lost profit area, which is the triangle below the marginal cost curve and above the marginal revenue curve, between the quantities of 11.25 and 15. This is lost profit because for each of these 3.75 units extra revenue earned was less than extra cost incurred. This area can be calculated as 0.5*(60-45)*3.75+0.5*(45-30)*3.75=$56.25. The second method of graphically illustrating the difference in the two profit levels is to draw in the average cost curve and identify the two profit boxes. The profit box is the difference between the total revenue box (price times quantity) and the total cost box (average cost times quantity). The monopolist will gain two areas and lose one area as compared to the competitive firm, and these areas will sum to $56.25. M C MR Demand 11.25 15 lost profit Q P 7. Suppose a profit-maximizing monopolist is producing 800 units of output and is charging a price of $40 per unit. a. If the elasticity of demand for the product is –2, find the marginal cost of the last unit produced. Recall that the monopolist’s pricing rule as a function of the elasticity of demand for its product is: