正在加载图片...
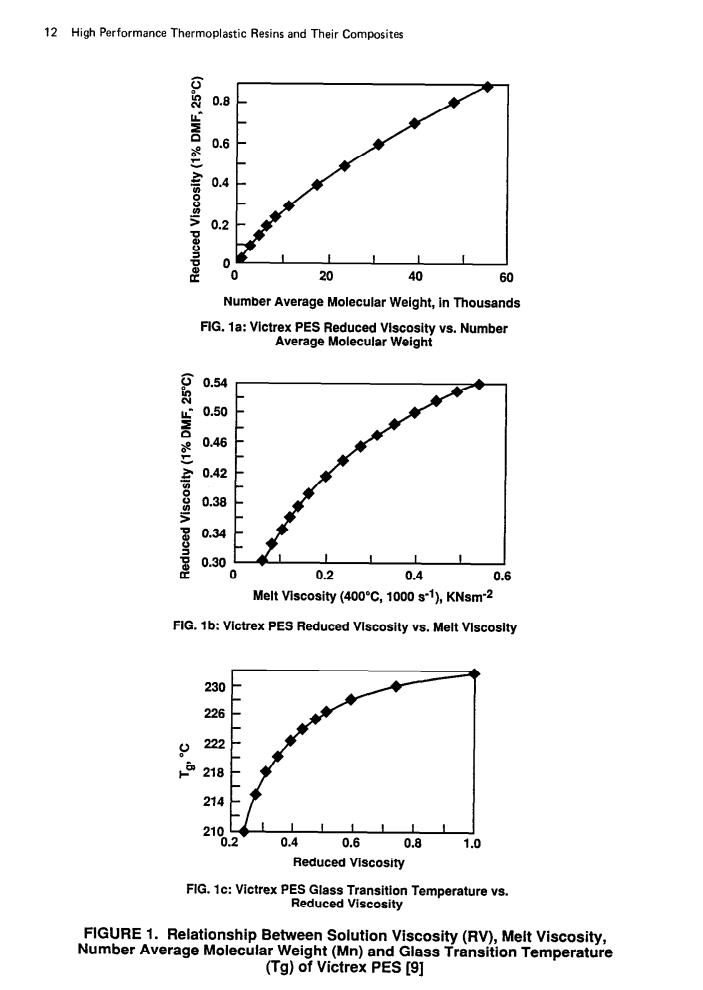
12 High Performance Thermoplastic Resins and Their Composites 0.8 0.6 0.4 0.2 0 0 20 40 60 Number Average Molecular Weight,in Thousands FIG,1a:Victrex PES Reduced VIscosity vs.Number Average Molecular Weight 0.54 0.50 0.42 0.38 0.34 0.30 0.2 0.4 0.6 Melt Viscosity (400C,1000 s-1),KNsm-2 FIG.1b:Victrex PES Reduced VIscosity vs.Melt VIscoslty 230 226 222 218 214 210 0.2 0.4 0.6 0.8 1.0 Reduced Viscosity FIG.1c:Victrex PES Glass Transition Temperature vs. Reduced Viscosity FIGURE 1.Relationship Between Solution Viscosity(RV),Melt Viscosity, Number Average Molecular Weight(Mn)and Glass Transition Temperature (Tg)of Victrex PES [9]12 High Performance Thermoplastic Resins and Their Composites z 0 20 40 60 Number Average Molecular Weight, in Thousands FIG. la: Victrex PES Reduced Viscosity vs. Number Average Molecular Weight g 0.54 ;- 0.50 % ae 0.46 r ; 0.42 8 4 0.38 > $ 0.34 s p 0.30 I I I 1 K 0 0.2 0.4 0.6 Melt Viscosity (4OO”C, 1000 s-l), KNsm-* FIG. 1 b: Vlctrex PES Reduced Vlscoslty vs. Melt Viscosity 230 - Reduced Viscosity FIG. lc: Victrex PES Glass Transition Temperature vs. Reduced Viscosity FIGURE 1. Relationship Between Solution Viscosity (RV), Melt Viscosity, Number Average Molecular Weight (Mn) and Glass Transition Temperature (Tg) of Victrex PES [9]