正在加载图片...

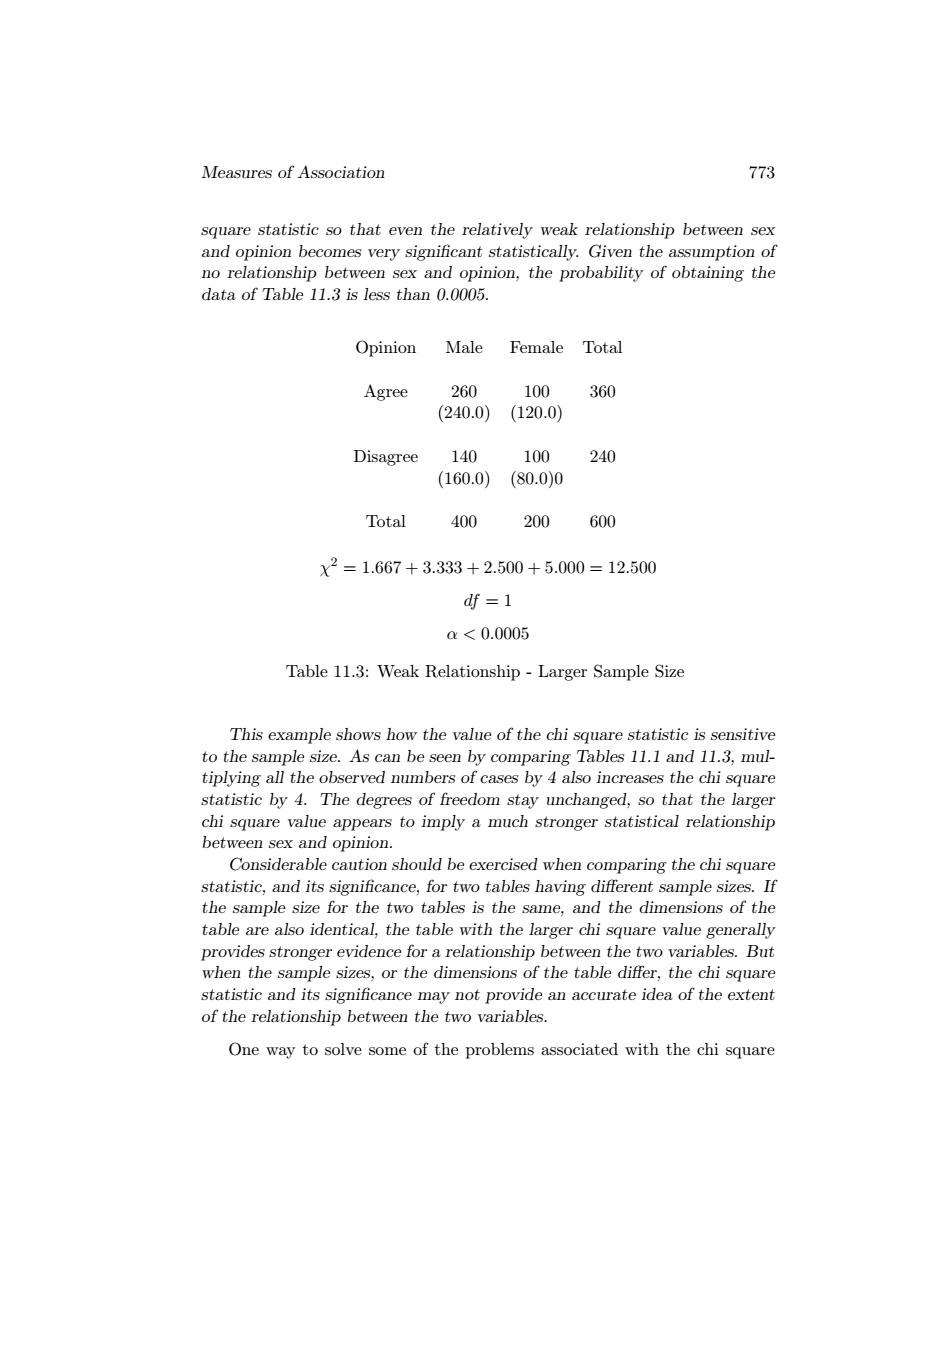
Measures of Association 773 square statistic so that even the relatively weak relationship between sex and opinion becomes very significant statistically.Given the assumption of no relationship between sex and opinion,the probability of obtaining the data of Table 11.3 is less than 0.0005. Opinion Male Female Total Agree 260 100 360 (240.0) (120.0) Disagree 140 100 240 (160.0)(80.0)0 Total 400 200 600 X2=1.667+3.333+2.500+5.000=12.500 df=1 a<0.0005 Table 11.3:Weak Relationship-Larger Sample Size This example shows how the value of the chi square statistic is sensitive to the sample size.As can be seen by comparing Tables 11.1 and 11.3,mul- tiplying all the observed numbers of cases by 4 also increases the chi square statistic by 4.The degrees of freedom stay unchanged,so that the larger chi square value appears to imply a much stronger statistical relationship between sex and opinion. Considerable caution should be exercised when comparing the chi square statistic,and its significance,for two tables having different sample sizes.If the sample size for the two tables is the same,and the dimensions of the table are also identical,the table with the larger chi square value generally provides stronger evidence for a relationship between the two variables.But when the sample sizes,or the dimensions of the table differ,the chi square statistic and its significance may not provide an accurate idea of the extent of the relationship between the two variables. One way to solve some of the problems associated with the chi squareMeasures of Association 773 square statistic so that even the relatively weak relationship between sex and opinion becomes very significant statistically. Given the assumption of no relationship between sex and opinion, the probability of obtaining the data of Table 11.3 is less than 0.0005. Opinion Male Female Total Agree 260 100 360 (240.0) (120.0) Disagree 140 100 240 (160.0) (80.0)0 Total 400 200 600 χ 2 = 1.667 + 3.333 + 2.500 + 5.000 = 12.500 df = 1 α < 0.0005 Table 11.3: Weak Relationship - Larger Sample Size This example shows how the value of the chi square statistic is sensitive to the sample size. As can be seen by comparing Tables 11.1 and 11.3, multiplying all the observed numbers of cases by 4 also increases the chi square statistic by 4. The degrees of freedom stay unchanged, so that the larger chi square value appears to imply a much stronger statistical relationship between sex and opinion. Considerable caution should be exercised when comparing the chi square statistic, and its significance, for two tables having different sample sizes. If the sample size for the two tables is the same, and the dimensions of the table are also identical, the table with the larger chi square value generally provides stronger evidence for a relationship between the two variables. But when the sample sizes, or the dimensions of the table differ, the chi square statistic and its significance may not provide an accurate idea of the extent of the relationship between the two variables. One way to solve some of the problems associated with the chi square