正在加载图片...
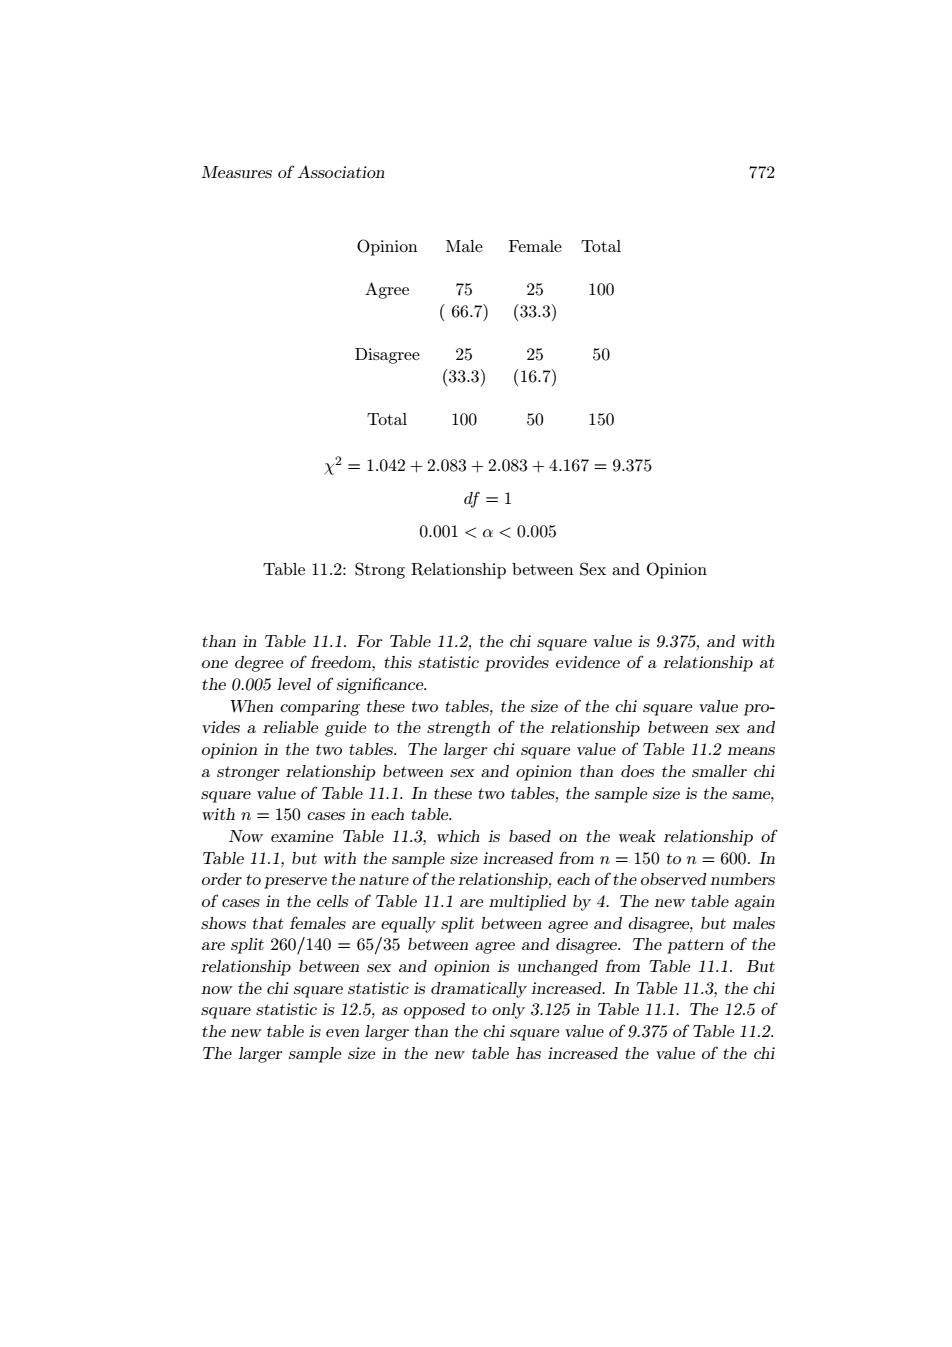
Measures of Association 772 Opinion Male Female Total Agree 75 25 100 (66.7)(33.3) Disagree 25 25 50 (33.3) (16.7) Total 100 50 150 X2=1.042+2.083+2.083+4.167=9.375 df =1 0.001<a<0.005 Table 11.2:Strong Relationship between Sex and Opinion than in Table 11.1.For Table 11.2,the chi square value is 9.375,and with one degree of freedom,this statistic provides evidence of a relationship at the 0.005 level of significance. When comparing these two tables,the size of the chi square value pro- vides a reliable guide to the strength of the relationship between sex and opinion in the two tables.The larger chi square value of Table 11.2 means a stronger relationship between sex and opinion than does the smaller chi square value of Table 11.1.In these two tables,the sample size is the same, with n =150 cases in each table. Now examine Table 11.3,which is based on the weak relationship of Table 11.1,but with the sample size increased from n=150 to n=600.In order to preserve the nature of the relationship,each of the observed numbers of cases in the cells of Table 11.1 are multiplied by 4.The new table again shows that females are equally split between agree and disagree,but males are split 260/140=65/35 between agree and disagree.The pattern of the relationship between sex and opinion is unchanged from Table 11.1.But now the chi square statistic is dramatically increased.In Table 11.3,the chi square statistic is 12.5,as opposed to only 3.125 in Table 11.1.The 12.5 of the new table is even larger than the chi square value of 9.375 of Table 11.2. The larger sample size in the new table has increased the value of the chiMeasures of Association 772 Opinion Male Female Total Agree 75 25 100 ( 66.7) (33.3) Disagree 25 25 50 (33.3) (16.7) Total 100 50 150 χ 2 = 1.042 + 2.083 + 2.083 + 4.167 = 9.375 df = 1 0.001 < α < 0.005 Table 11.2: Strong Relationship between Sex and Opinion than in Table 11.1. For Table 11.2, the chi square value is 9.375, and with one degree of freedom, this statistic provides evidence of a relationship at the 0.005 level of significance. When comparing these two tables, the size of the chi square value provides a reliable guide to the strength of the relationship between sex and opinion in the two tables. The larger chi square value of Table 11.2 means a stronger relationship between sex and opinion than does the smaller chi square value of Table 11.1. In these two tables, the sample size is the same, with n = 150 cases in each table. Now examine Table 11.3, which is based on the weak relationship of Table 11.1, but with the sample size increased from n = 150 to n = 600. In order to preserve the nature of the relationship, each of the observed numbers of cases in the cells of Table 11.1 are multiplied by 4. The new table again shows that females are equally split between agree and disagree, but males are split 260/140 = 65/35 between agree and disagree. The pattern of the relationship between sex and opinion is unchanged from Table 11.1. But now the chi square statistic is dramatically increased. In Table 11.3, the chi square statistic is 12.5, as opposed to only 3.125 in Table 11.1. The 12.5 of the new table is even larger than the chi square value of 9.375 of Table 11.2. The larger sample size in the new table has increased the value of the chi