正在加载图片...

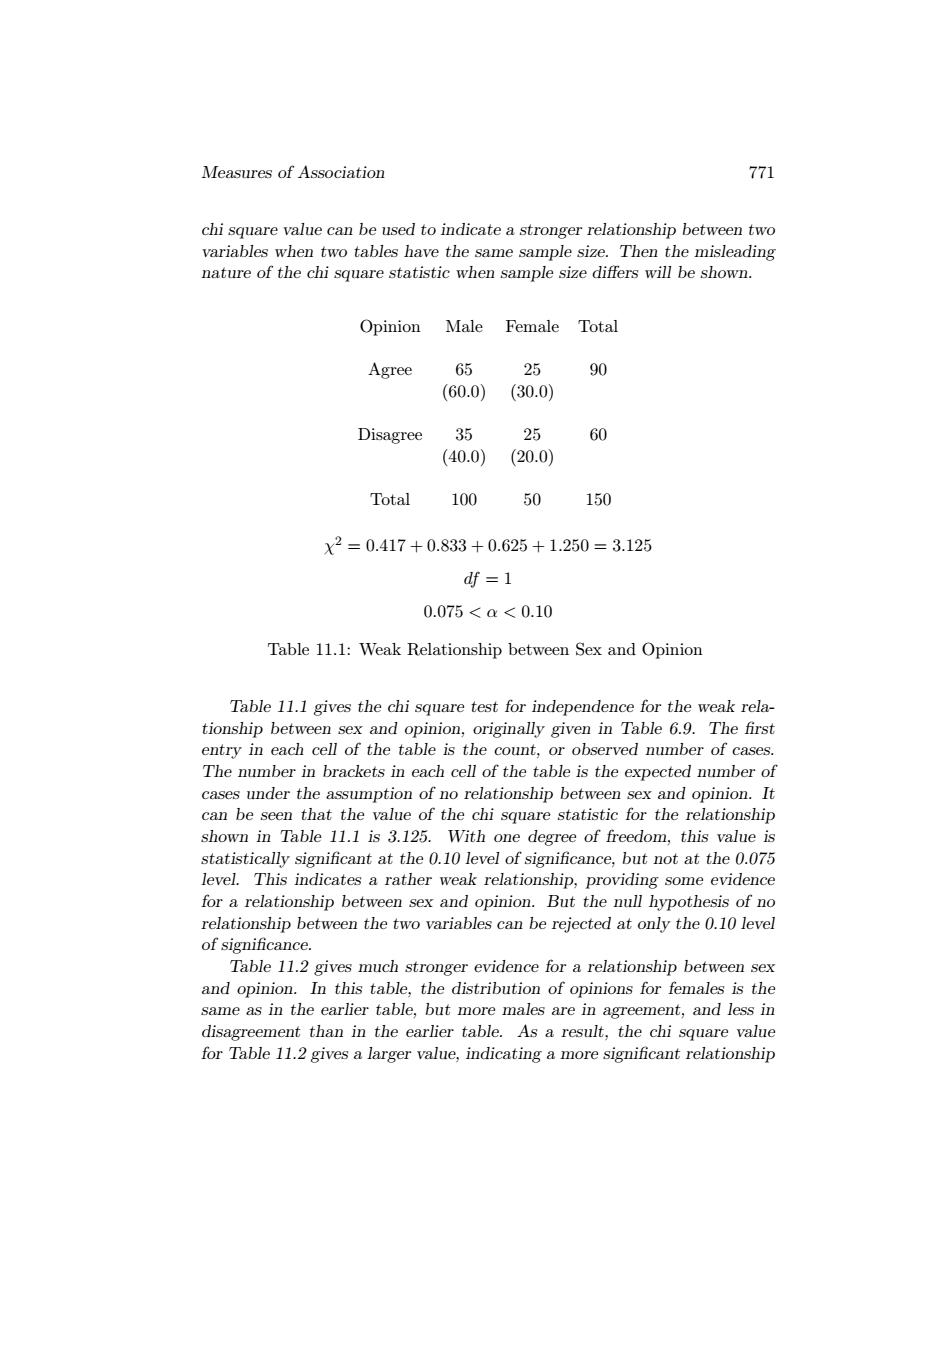
Measures of Association 771 chi square value can be used to indicate a stronger relationship between two variables when two tables have the same sample size.Then the misleading nature of the chi square statistic when sample size differs will be shown. Opinion Male Female Total Agree 65 25 90 (60.0) (30.0) Disagree 35 25 60 (40.0) (20.0】 Total 100 50 150 X2=0.417+0.833+0.625+1.250=3.125 df =1 0.075<a<0.10 Table 11.1:Weak Relationship between Sex and Opinion Table 11.1 gives the chi square test for independence for the weak rela- tionship between sex and opinion,originally given in Table 6.9.The first entry in each cell of the table is the count,or observed number of cases. The number in brackets in each cell of the table is the expected number of cases under the assumption of no relationship between sex and opinion.It can be seen that the value of the chi square statistic for the relationship shown in Table 11.1 is 3.125.With one degree of freedom,this value is statistically significant at the 0.10 level of significance,but not at the 0.075 level.This indicates a rather weak relationship,providing some evidence for a relationship between sex and opinion.But the null hypothesis of no relationship between the two variables can be rejected at only the 0.10 level of significance. Table 11.2 gives much stronger evidence for a relationship between sex and opinion.In this table,the distribution of opinions for females is the same as in the earlier table,but more males are in agreement,and less in disagreement than in the earlier table.As a result,the chi square value for Table 11.2 gives a larger value,indicating a more significant relationshipMeasures of Association 771 chi square value can be used to indicate a stronger relationship between two variables when two tables have the same sample size. Then the misleading nature of the chi square statistic when sample size differs will be shown. Opinion Male Female Total Agree 65 25 90 (60.0) (30.0) Disagree 35 25 60 (40.0) (20.0) Total 100 50 150 χ 2 = 0.417 + 0.833 + 0.625 + 1.250 = 3.125 df = 1 0.075 < α < 0.10 Table 11.1: Weak Relationship between Sex and Opinion Table 11.1 gives the chi square test for independence for the weak relationship between sex and opinion, originally given in Table 6.9. The first entry in each cell of the table is the count, or observed number of cases. The number in brackets in each cell of the table is the expected number of cases under the assumption of no relationship between sex and opinion. It can be seen that the value of the chi square statistic for the relationship shown in Table 11.1 is 3.125. With one degree of freedom, this value is statistically significant at the 0.10 level of significance, but not at the 0.075 level. This indicates a rather weak relationship, providing some evidence for a relationship between sex and opinion. But the null hypothesis of no relationship between the two variables can be rejected at only the 0.10 level of significance. Table 11.2 gives much stronger evidence for a relationship between sex and opinion. In this table, the distribution of opinions for females is the same as in the earlier table, but more males are in agreement, and less in disagreement than in the earlier table. As a result, the chi square value for Table 11.2 gives a larger value, indicating a more significant relationship