正在加载图片...

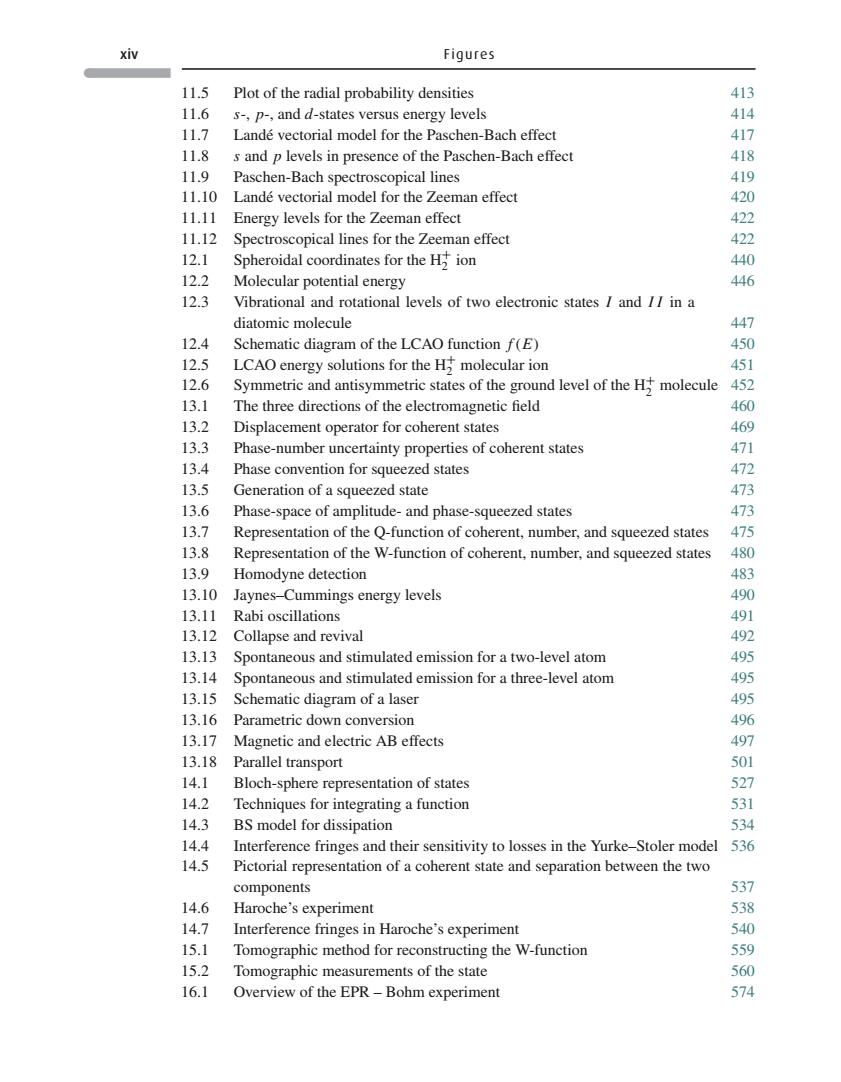
xiv Figures 11.5 Plot of the radial probability densities 413 11.6 s-,p-,and d-states versus energy levels 414 11.7 Lande vectorial model for the Paschen-Bach effect s and p levels in presence of the Paschen-Bach effect 11.9 Paschen-Bach spectroscopical lines 419 1110 lande vectorial model for the zeeman effect 11.11 Energy levels for the Zeeman effect 11.12 Spectroscopical lines for the Zeeman effect 物 12.1 Spheroidal coordinates for the H ion 440 122 Molecular potential energy 446 12.3 Vibrational and rotational levels of two electronic states I and II in a diatomic molecule 447 12.4 Schematic diagram of the LCAo function f(E) 450 molecular ion H时molecule 15 13.1 The three directions of the electromagnetic field 460 13.2 Displacement operator for coherent states Phase-number certainty properties of cohe tates Phase convention for squeezed states 13.5 Generation of a squeezed state 473 13.6 Phase-space of amplitude-and phas squeezed states 4 13.7 Representation of the Q-function of coh erent,number,and squeezed states 475 13.8 Representation of the W-function of coherent,number.and squeezed states 13.9 Homodyne detection 483 13.10 Jaynes-Cummings energy levels 13.11 Rabi oscillations 13.12 Collapse and revival 13.13 Spontaneous and stimulated emission for a two-level atom 495 13.14 Spontaneous and stimulated emission for a three-level atom 13.15 Schematic diagram of a laser 13.16 Parametric down conversion 496 13.17 Magnetic and electric ab effects 497 13.18 Parallel transpor 14.1 Bloch-sphere representation of states 14.2 Techniques for integrating a function 531 14.3 B model for dissipation 144 Interference fringes and their sensitivity to losses in the Yurke-Stoler mode 14.5 Pictorial representation of a coherent state and separation between the two components 537 Haroche's experiment Interference fringes in Haroche's experiment 15.1 Tomographic method for reconstructing the W-function 15.2 Tomographic measurements of the state 560 16.1 Overview of the EPR-Bohm experimen 574 xiv Figures 11.5 Plot of the radial probability densities 413 11.6 s-, p-, and d-states versus energy levels 414 11.7 Landé vectorial model for the Paschen-Bach effect 417 11.8 s and p levels in presence of the Paschen-Bach effect 418 11.9 Paschen-Bach spectroscopical lines 419 11.10 Landé vectorial model for the Zeeman effect 420 11.11 Energy levels for the Zeeman effect 422 11.12 Spectroscopical lines for the Zeeman effect 422 12.1 Spheroidal coordinates for the H+ 2 ion 440 12.2 Molecular potential energy 446 12.3 Vibrational and rotational levels of two electronic states I and I I in a diatomic molecule 447 12.4 Schematic diagram of the LCAO function f (E) 450 12.5 LCAO energy solutions for the H+ 2 molecular ion 451 12.6 Symmetric and antisymmetric states of the ground level of the H+ 2 molecule 452 13.1 The three directions of the electromagnetic field 460 13.2 Displacement operator for coherent states 469 13.3 Phase-number uncertainty properties of coherent states 471 13.4 Phase convention for squeezed states 472 13.5 Generation of a squeezed state 473 13.6 Phase-space of amplitude- and phase-squeezed states 473 13.7 Representation of the Q-function of coherent, number, and squeezed states 475 13.8 Representation of the W-function of coherent, number, and squeezed states 480 13.9 Homodyne detection 483 13.10 Jaynes–Cummings energy levels 490 13.11 Rabi oscillations 491 13.12 Collapse and revival 492 13.13 Spontaneous and stimulated emission for a two-level atom 495 13.14 Spontaneous and stimulated emission for a three-level atom 495 13.15 Schematic diagram of a laser 495 13.16 Parametric down conversion 496 13.17 Magnetic and electric AB effects 497 13.18 Parallel transport 501 14.1 Bloch-sphere representation of states 527 14.2 Techniques for integrating a function 531 14.3 BS model for dissipation 534 14.4 Interference fringes and their sensitivity to losses in the Yurke–Stoler model 536 14.5 Pictorial representation of a coherent state and separation between the two components 537 14.6 Haroche’s experiment 538 14.7 Interference fringes in Haroche’s experiment 540 15.1 Tomographic method for reconstructing the W-function 559 15.2 Tomographic measurements of the state 560 16.1 Overview of the EPR – Bohm experiment 574�