正在加载图片...

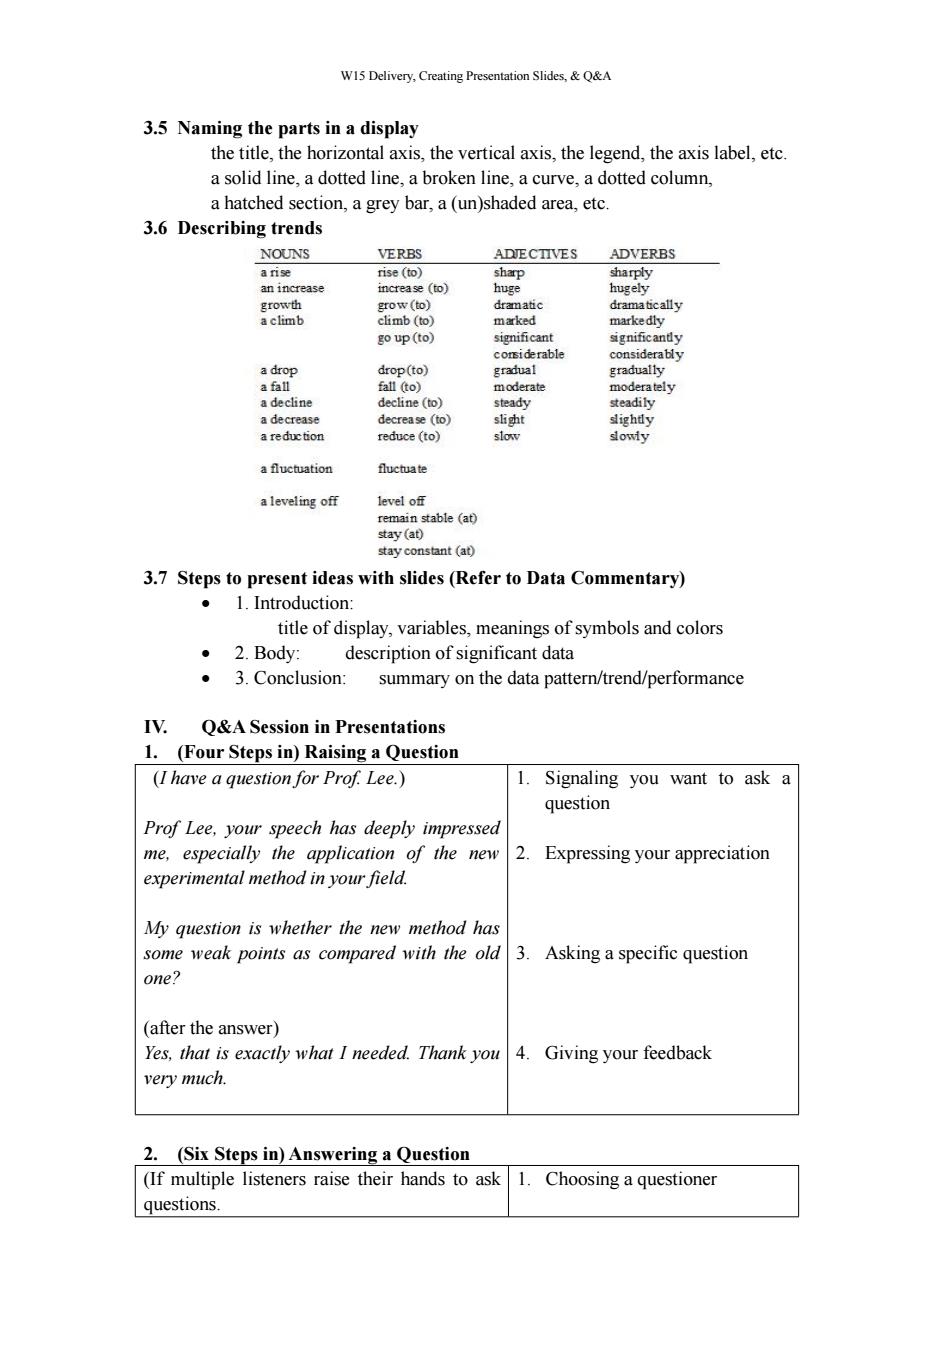
W15 Delivery,Creating Presentation Slides,&Q&A 3.5 Naming the parts in a display the title,the horizontal axis,the vertical axis,the legend,the axis label,etc. a solid line,a dotted line,a broken line,a curve,a dotted column, a hatched section,a grey bar,a (un)shaded area,etc. 3.6 Describing trends NOUNS VERBS ADECTIVES ADVERBS a rise rise (to) sharp sharply an increase increase (to) huge hugely growth grow (to) dramatic dramatically a climb climb (to) marked markedly go up(to) significant significandy comsiderable considerably a drop drop(to) gradual gradually a fall fall (to) moderate moderately a decline decline(to) steady steadily a decrease decrease (to) si中t slighty a reduction reduce (to) slow sowiy a fluctuation fluctuate a leveling off level off remain stable (at) stay(at) stay constant (at) 3.7 Steps to present ideas with slides(Refer to Data Commentary) ·l.Introduction: title of display,variables,meanings of symbols and colors ·2.Body: description of significant data ·3.Conclusion: summary on the data pattern/trend/performance IV. Q&A Session in Presentations 1.(Four Steps in)Raising a Question (I have a question for Prof.Lee.) 1.Signaling you want to ask a question Prof Lee,your speech has deeply impressed me,especially the application of the new 2.Expressing your appreciation experimental method in your field. My question is whether the new method has some weak points as compared with the old 3.Asking a specific question one? (after the answer) Yes,that is exactly what I needed.Thank you 4.Giving your feedback very much. 2.(Six Steps in)Answering a Question (If multiple listeners raise their hands to ask 1. Choosing a questioner questions.W15 Delivery, Creating Presentation Slides, & Q&A 3.5 Naming the parts in a display the title, the horizontal axis, the vertical axis, the legend, the axis label, etc. a solid line, a dotted line, a broken line, a curve, a dotted column, a hatched section, a grey bar, a (un)shaded area, etc. 3.6 Describing trends 3.7 Steps to present ideas with slides (Refer to Data Commentary) 1. Introduction: title of display, variables, meanings of symbols and colors 2. Body: description of significant data 3. Conclusion: summary on the data pattern/trend/performance IV. Q&A Session in Presentations 1. (Four Steps in) Raising a Question (I have a question for Prof. Lee.) Prof Lee, your speech has deeply impressed me, especially the application of the new experimental method in your field. My question is whether the new method has some weak points as compared with the old one? (after the answer) Yes, that is exactly what I needed. Thank you very much. 1. Signaling you want to ask a question 2. Expressing your appreciation 3. Asking a specific question 4. Giving your feedback 2. (Six Steps in) Answering a Question (If multiple listeners raise their hands to ask questions. 1. Choosing a questioner