正在加载图片...
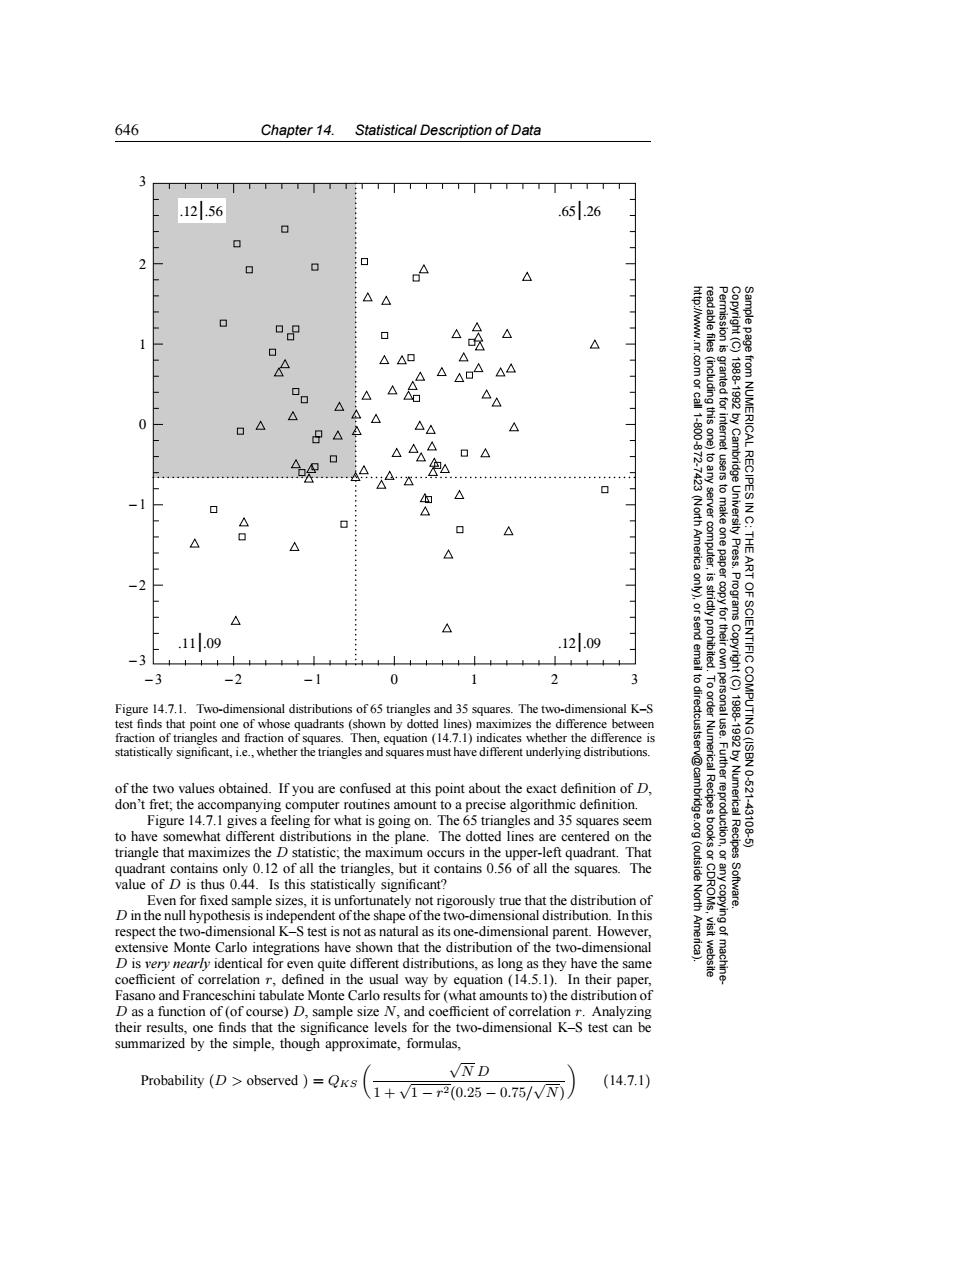
646 Chapter 14.Statistical Description of Data 1256 6526 口 N △ of △ △ N △△0 △AA△4 83 ◇◇ △ DD 18881992 0 △ △△ 日△A D 11-600 (including this one) 872 …4△…次不2… 7423 from NUMERICAL RECIPES IN △ ◇ A △ △ 7 (North America to any server computer, tusers to make one paper /Cambridge University Press.Programs THE -2 是 ART △ .11.09 .12.09 strictly prohibited -3 -3 -2 -1 0 1 2 3 to dir Copyright (C) Figure 14.7.1.Two-dimensional distributions of 65 triangles and 35 squares.The two-dimensional K-S test finds that point one of whose quadrants (shown by dotted lines)maximizes the difference between fraction of triangles and fraction of squares.Then,equation (14.7.1)indicates whether the difference is ectcustser statistically significant,i.e.,whether the triangles and squares must have different underlying distributions. 1788-1982 OF SCIENTIFIC COMPUTING(ISBN v@cam of the two values obtained.If you are confused at this point about the exact definition of D. 10-621 don't fret;the accompanying computer routines amount to a precise algorithmic definition. Figure 14.7.1 gives a feeling for what is going on.The 65 triangles and 35 squares seem to have somewhat different distributions in the plane.The dotted lines are centered on the Numerical Recipes 43108-5 triangle that maximizes the D statistic,the maximum occurs in the upper-left quadrant.That quadrant contains only 0.12 of all the triangles,but it contains 0.56 of all the squares.The (outside value of D is thus 0.44.Is this statistically significant? Even for fixed sample sizes,it is unfortunately not rigorously true that the distribution of North Software. D in the null hypothesis is independent of the shape of the two-dimensional distribution.In this respect the two-dimensional K-S test is not as natural as its one-dimensional parent.However, extensive Monte Carlo integrations have shown that the distribution of the two-dimensional D is very nearly identical for even quite different distributions,as long as they have the same coefficient of correlation r,defined in the usual way by equation(14.5.1).In their paper, Fasano and Franceschini tabulate Monte Carlo results for (what amounts to)the distribution of D as a function of (of course)D,sample size N,and coefficient of correlation r.Analyzing their results,one finds that the significance levels for the two-dimensional K-S test can be summarized by the simple,though approximate,formulas, Probability (D>observed )=QKs VND (14.7.1) \1+√1-r2(0.25-0.75//N)646 Chapter 14. Statistical Description of Data Permission is granted for internet users to make one paper copy for their own personal use. Further reproduction, or any copyin Copyright (C) 1988-1992 by Cambridge University Press. Programs Copyright (C) 1988-1992 by Numerical Recipes Software. Sample page from NUMERICAL RECIPES IN C: THE ART OF SCIENTIFIC COMPUTING (ISBN 0-521-43108-5) g of machinereadable files (including this one) to any server computer, is strictly prohibited. To order Numerical Recipes books or CDROMs, visit website http://www.nr.com or call 1-800-872-7423 (North America only), or send email to directcustserv@cambridge.org (outside North America). − 3 − 2 − 1 012 3 − 3 − 2 − 1 0 1 2 3 .11|.09 .65|.26 .12|.09 .12|.56 Figure 14.7.1. Two-dimensional distributions of 65 triangles and 35 squares. The two-dimensional K–S test finds that point one of whose quadrants (shown by dotted lines) maximizes the difference between fraction of triangles and fraction of squares. Then, equation (14.7.1) indicates whether the difference is statistically significant, i.e., whether the triangles and squares must have different underlying distributions. of the two values obtained. If you are confused at this point about the exact definition of D, don’t fret; the accompanying computer routines amount to a precise algorithmic definition. Figure 14.7.1 gives a feeling for what is going on. The 65 triangles and 35 squares seem to have somewhat different distributions in the plane. The dotted lines are centered on the triangle that maximizes the D statistic; the maximum occurs in the upper-left quadrant. That quadrant contains only 0.12 of all the triangles, but it contains 0.56 of all the squares. The value of D is thus 0.44. Is this statistically significant? Even for fixed sample sizes, it is unfortunately not rigorously true that the distribution of D in the null hypothesis is independent of the shape of the two-dimensional distribution. In this respect the two-dimensional K–S test is not as natural as its one-dimensional parent. However, extensive Monte Carlo integrations have shown that the distribution of the two-dimensional D is very nearly identical for even quite different distributions, as long as they have the same coefficient of correlation r, defined in the usual way by equation (14.5.1). In their paper, Fasano and Franceschini tabulate Monte Carlo results for (what amounts to) the distribution of D as a function of (of course) D, sample size N, and coefficient of correlation r. Analyzing their results, one finds that the significance levels for the two-dimensional K–S test can be summarized by the simple, though approximate, formulas, Probability (D > observed ) = QKS √N D 1 + √1 − r2(0.25 − 0.75/ √N) (14.7.1)�