正在加载图片...
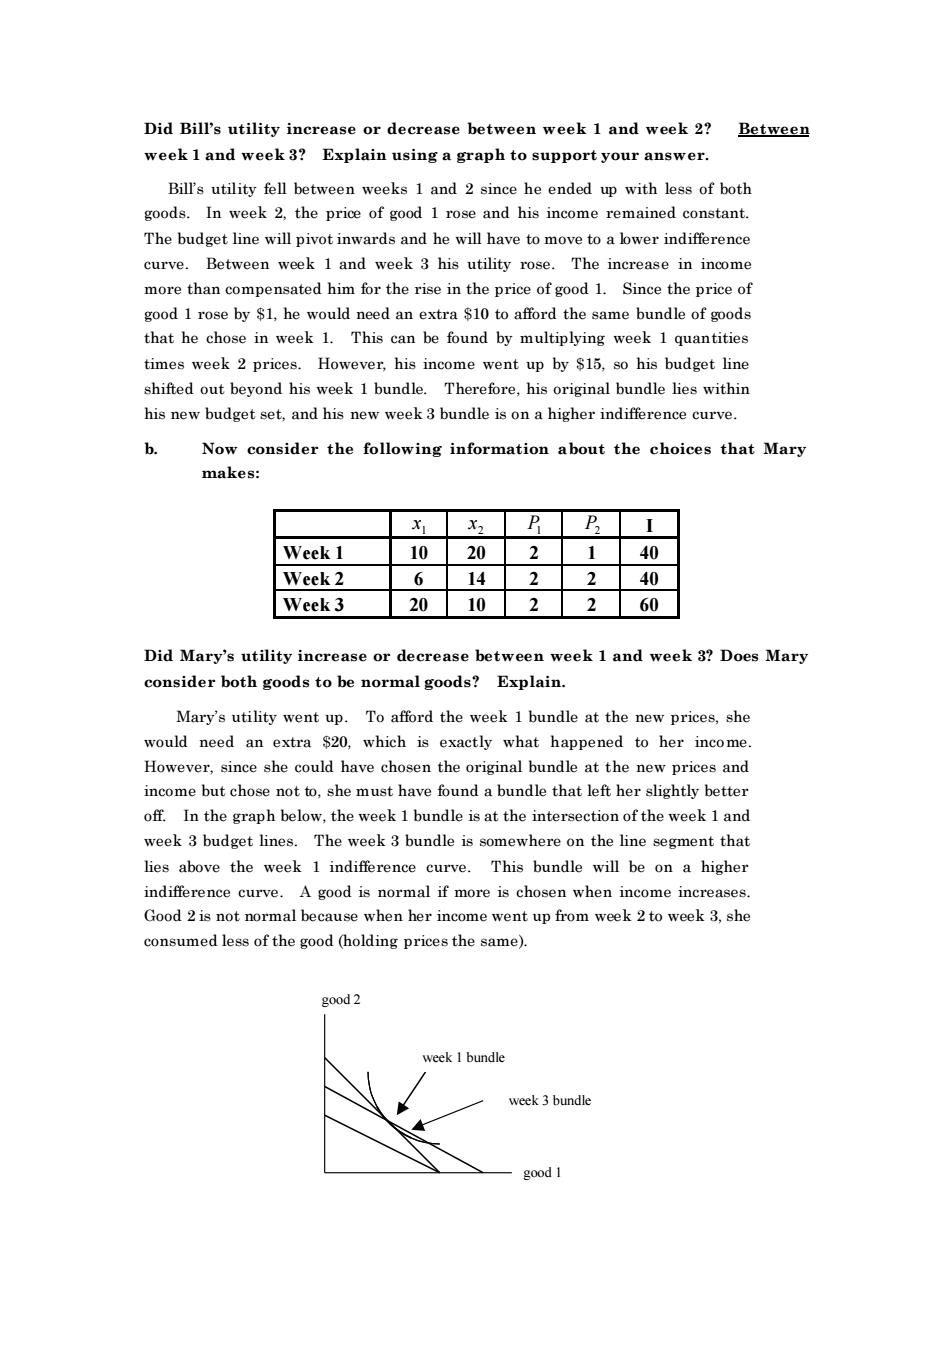
Did Bill's utility increase or decrease between week I and week 2?Between week 1 and week3?Explain using a graph to support your answer. Bill's utility fell between weeks 1 and 2 since he ended up with less of both goods.In week 2.the price of good 1 rose and his income remained constant. The budget line will pivot inwards and he will have to move to a lower indifference curve.Between week 1 and week 3 his utility rose.The increase in income more than compensated him for the rise in the price of good 1 since the price of tra $10 to afford the same bundle ofgo in week】 This can be found by multiplying week I quantities times week 2 prices. However,his income went up by $15,so his budget line shifted out beyond his week I bundle.Therefore,his original bundle lies within his new budget set,and his new week 3 bundle is on a higher indifference curve. 6 Now consider the following information about the choices that mary x x2 PP I Week I Week 2 Week 3 20102 Did Mary's utility increase or decrease between week 1 and week 3?Does Mary consider both goods to be normal goods?Explain. Mary's utility went up.To afford the week 1 bundle at the new prices,she would need an extra $20,which is exactly what happened to her income. However,since she could have chosen the original bundle at the new prices and income but chose not to,she must have found a bundle that left her slightly better off In the graph below,the week1 bundle is at the intersection of the week Iand week3 budget lines.The week bundle is somewhere on the line segment tha lies above the week 1 indifference curve.This bundle will be on a higher indifference curve.A good is normal if more is chosen when income increases. Good 2is not normal because when her income went up from week 2 to week 3.she consumed less of the good (holding prices the same). k 3 bundl oodDid Bill’s utility increase or decrease between week 1 and week 2? Between week 1 and week 3? Explain using a graph to support your answer. Bill’s utility fell between weeks 1 and 2 since he ended up with less of both goods. In week 2, the price of good 1 rose and his income remained constant. The budget line will pivot inwards and he will have to move to a lower indifference curve. Between week 1 and week 3 his utility rose. The increase in income more than compensated him for the rise in the price of good 1. Since the price of good 1 rose by $1, he would need an extra $10 to afford the same bundle of goods that he chose in week 1. This can be found by multiplying week 1 quantities times week 2 prices. However, his income went up by $15, so his budget line shifted out beyond his week 1 bundle. Therefore, his original bundle lies within his new budget set, and his new week 3 bundle is on a higher indifference curve. b. Now consider the following information about the choices that Mary makes: x1 x2 P1 P2 I Week 1 10 20 2 1 40 Week 2 6 14 2 2 40 Week 3 20 10 2 2 60 Did Mary’s utility increase or decrease between week 1 and week 3? Does Mary consider both goods to be normal goods? Explain. Mary’s utility went up. To afford the week 1 bundle at the new prices, she would need an extra $20, which is exactly what happened to her income. However, since she could have chosen the original bundle at the new prices and income but chose not to, she must have found a bundle that left her slightly better off. In the graph below, the week 1 bundle is at the intersection of the week 1 and week 3 budget lines. The week 3 bundle is somewhere on the line segment that lies above the week 1 indifference curve. This bundle will be on a higher indifference curve. A good is normal if more is chosen when income increases. Good 2 is not normal because when her income went up from week 2 to week 3, she consumed less of the good (holding prices the same). week 1 bundle week 3 bundle good 1 good 2