CHAPTER 4 INDIVIDUALAND MARKET DEMAND 一、QUESTIONS FOR REVIEW 1.Explain the difference between each of the following termss a.a price consumption curve and a demand curve; A price consumption curve identifies the utility maximizing combinations of two goods as the price of one of the goods changes.When the price of one of the goods declines the budget line will pivot outwards and a new utility maximizing bundle will be chosen. The price sumption curve connects all such bundles. A demand curve is a graphical relationship between the price of a good and the(utility aximizing) quantity demanded of a good,all else the same.Price is plotted on the vertical axis and quantity demanded on the horizontal axis. b.an individual demand curve and a market demand curve; An individual demand curve identifies the (utility maximizing)quantity demanded by oneper at any given price of the good.Amarket demand the of the individual demand At any giver price,the e market demand curve identifies the quantity demanded by al individuals,all else the same. c.an Engel curve and a demand curve; A demand curve identifies the quantity demanded of a good for any given price. holding income and all else the same.An Engel curve identifies the quantity demanded ofa good for any given income,holding prices and all else the same. d.an income effect and a substitution effect: The the effect ofachange in the price on the consumption of the good,utility held constant This change in price changes the slope of the budget line and causes the consumer to rotate along the current indifference curve.The income effect measures the effect of a change in purchasing power(caused by a change in the price of a good)on the consumption of the good. relative prices held co nstant For ex ample,a inrease in the price of good 1(onthe horizonta axis)will rotate the budget line down along the indifferen e curve as the slope of the budget line(the relative price ratio)changes. This is the substitution effect.This new budget line will then shift inwards to reflect the decline in purchasing power caused by the increase in the price of the good.This is the income effect. 2.Suppose that an individual allocates his or her entire budget between two goods,food and clothing. Can both goods be inferior?Explain If an individual consumes only food and clothing then any increase in income must be spent oneither foo or elothing (recall,we assume there are no saving).If
CHAPTER 4 INDIVIDUAL AND MARKET DEMAND 一、QUESTIONS FOR REVIEW 1. Explain the difference between each of the following terms: a. a price consumption curve and a demand curve; A price consumption curve identifies the utility maximizing combinations of two goods as the price of one of the goods changes. When the price of one of the goods declines, the budget line will pivot outwards, and a new utility maximizing bundle will be chosen. The price consumption curve connects all such bundles. A demand curve is a graphical relationship between the price of a good and the (utility aximizing) quantity demanded of a good, all else the same. Price is plotted on the vertical axis and quantity demanded on the horizontal axis. b. an individual demand curve and a market demand curve; An individual demand curve identifies the (utility maximizing) quantity demanded by one person at any given price of the good. A market demand curve is the sum of the individual demand curves for any given product. At any given price, the market demand curve identifies the quantity demanded by all individuals, all else the same. c. an Engel curve and a demand curve; A demand curve identifies the quantity demanded of a good for any given price, holding income and all else the same. An Engel curve identifies the quantity demanded of a good for any given income, holding prices and all else the same. d. an income effect and a substitution effect; The substitution effect measures the effect of a change in the price of a good on the consumption of the good, utility held constant. This change in price changes the slope of the budget line and causes the consumer to rotate along the current indifference curve. The income effect measures the effect of a change in purchasing power (caused by a change in the price of a good) on the consumption of the good, relative prices held constant. For example, an increase in the price of good 1 (on the horizontal axis) will rotate the budget line down along the indifference curve as the slope of the budget line (the relative price ratio) changes. This is the substitution effect. This new budget line will then shift inwards to reflect the decline in purchasing power caused by the increase in the price of the good. This is the income effect. 2. Suppose that an individual allocates his or her entire budget between two goods, food and clothing. Can both goods be inferior? Explain. If an individual consumes only food and clothing, then any increase in income must be spent on either food or clothing (recall, we assume there are no savings). If
food is an inferior good,then,as income increases consumption falls.With constant prices,the extra income not spent on food must be spent on clthing good.For both types of goods,normal and inferior,we still assume that more is preferred to less. 3.Explain whether the following statements are true or false. a.The marginal rate of substitution diminishes as an individual moves downward along the demand curve. This is true.The consumer will maximize his utility by choosing the bundle on his budget line where the price ratio is equal to the MRS.Suppose the =MRS.As the price of good 1 falls.the price ratio becomes a smaller number and hence the mrs becomes a smaller number.This means that as the price of good 1 falls,the another unit of good 1. b.The level of utility increases as an individual moves downward along the demand curve. This is true.As the price of a good falls,the budget line pivots outwards and the consumer is able to move to a higher indifference curve. c.Engel curves always slope upwards. This is false.The Engel curve identifies the relationship between the quantity demanded and the ame.Ifthegod isnr ases,quantity demanded will decrease,and the Engel curv will slope downwards 4.Tickets to a rock concert sell for $10.But at that price,the demand is substantially greater than the available number of tickets.Is the value or marginal benefit of an additional ticket greater than,less than,or equal to $10? How might you determine that value? If demand exceeds supply at aprice of $10.then consumers are willing to bid up the market price toa levelw here the quantity demanded is equal to the supplied. nce utility-maximizing consumers are willing to pay than $10 the marginal increase in satisfaction (value)is greater than S10 One way to determine the value of an additional ticket would be to auction it off.The highest bid would equal the marginal benefit of that ticket.If a bid was higher than the marginal benefit,then it would not make sense for the consumer to buy it.If abd was lower than arginal benefit. nother consumer ould bid exactly the marginal benefit,win the ticket,and still be maximizing satisfaction. 5.Which of the following combinations of goods are complements and which are substitutes?Could they be either in different circumstances?Discuss
food is an inferior good, then, as income increases, consumption falls. With constant prices, the extra income not spent on food must be spent on clothing. Therefore, as income increases, more is spent on clothing, i.e. clothing is a normal good. For both types of goods, normal and inferior, we still assume that more is preferred to less. 3. Explain whether the following statements are true or false. a. The marginal rate of substitution diminishes as an individual moves downward along the demand curve. This is true. The consumer will maximize his utility by choosing the bundle on his budget line where the price ratio is equal to the MRS. Suppose the consumer chooses the quantity of goods 1 and 2 such that P1 P2 = MRS. As the price of good 1 falls, the price ratio becomes a smaller number and hence the MRS becomes a smaller number. This means that as the price of good 1 falls, the consumer is willing to give up fewer units of good 2 in exchange for another unit of good 1. b. The level of utility increases as an individual moves downward along the demand curve. This is true. As the price of a good falls, the budget line pivots outwards and the consumer is able to move to a higher indifference curve. c. Engel curves always slope upwards. This is false. The Engel curve identifies the relationship between the quantity demanded of a good and income, all else the same. If the good is inferior, then as income increases, quantity demanded will decrease, and the Engel curve will slope downwards. 4. Tickets to a rock concert sell for $10. But at that price, the demand is substantially greater than the available number of tickets. Is the value or marginal benefit of an additional ticket greater than, less than, or equal to $10? How might you determine that value? If demand exceeds supply at a price of $10, then consumers are willing to bid up the market price to a level where the quantity demanded is equal to the quantity supplied. Since utility-maximizing consumers are willing to pay more than $10, the marginal increase in satisfaction (value) is greater than $10. One way to determine the value of an additional ticket would be to auction it off. The highest bid would equal the marginal benefit of that ticket. If a bid was higher than the marginal benefit, then it would not make sense for the consumer to buy it. If a bid was lower than the marginal benefit, another consumer would bid exactly the marginal benefit, win the ticket, and still be maximizing satisfaction. 5. Which of the following combinations of goods are complements and which are substitutes? Could they be either in different circumstances? Discuss
a.a mathematics elass and an economics class If the math elass and class in scheduling.then the ither comp ementsor substitutes. The math elass may illuminat economics,and the economics class can motivate mathematics.If the classes conflict,they are substitutes. b.tennis balls and a tennis racket Tennis balls and a tennis racket are both needed to play a game of tennis,thus they are complements. c.steak and lobster Foods can both complement and substitute for each other.Steak and bbster together. d.a plane trip and a train trip to the same destination Two modes of transportation between the same two points are substitutes for one another. e.bacon and eggs Bacon and eggs are often eaten together and are,therefore,complementary goods By considering them in relation to something else,such as pancakes bacon and eggs can function as substitutes sumer spends a fixed amount of income per month on the tortilla chips and salsa; tortilla chips and potato chips; C. movie tickets and gourmet coffee; travel by bus and travel by subway. 7.If the price of one of the goods increases,explain the effect on the quantity demanded of each of the goods.In each pair,which are likely to be complements and which are likely to be substitutes? a.If the price of tortilla chips increases,the demand for both goods will fall, assuming they are complementa. The demand curve for salsa will shift to the b.If the price of tortilla chips inereases,the demand for tortilla chips will fall and the demand for potato chips will rise,assuming they are substitutes.The demand curve for potato chips will shift to the right
a. a mathematics class and an economics class If the math class and the economics class do not conflict in scheduling, then the classes could be either complements or substitutes. The math class may illuminate economics, and the economics class can motivate mathematics. If the classes conflict, they are substitutes. b. tennis balls and a tennis racket Tennis balls and a tennis racket are both needed to play a game of tennis, thus they are complements. c. steak and lobster Foods can both complement and substitute for each other. Steak and lobster can compete, i.e., be substitutes, when they are listed as separate items on a menu. However, they can also function as complements because they are often served together. d. a plane trip and a train trip to the same destination Two modes of transportation between the same two points are substitutes for one another. e. bacon and eggs Bacon and eggs are often eaten together and are, therefore, complementary goods. By considering them in relation to something else, such as pancakes, bacon and eggs can function as substitutes. 6. Suppose that a consumer spends a fixed amount of income per month on the following pairs of goods: a. tortilla chips and salsa; b. tortilla chips and potato chips; c. movie tickets and gourmet coffee; d. travel by bus and travel by subway. 7. If the price of one of the goods increases, explain the effect on the quantity demanded of each of the goods. In each pair, which are likely to be complements and which are likely to be substitutes? a. If the price of tortilla chips increases, the demand for both goods will fall, assuming they are complements. The demand curve for salsa will shift to the left. b. If the price of tortilla chips increases, the demand for tortilla chips will fall and the demand for potato chips will rise, assuming they are substitutes. The demand curve for potato chips will shift to the right
c.If the price of movie tickets increases,the demand for movie tickets will fall. The demand for coffee is unchanged assuming the goods are unrelated.The demand curve for coffee is unchanged. d.If the price of bus travel increases then the demand for bus tickets will fall and the demand for subway tickets will rise,assuming they are substitutes.The demand curve for subway tickets will shift to the right. 8.Which of the following events would cause a movement along the demand curve for U.S.-produced clothing.and which would cause a shift in the demand curve? a.the removal of quotas on the importation of foreign clothes The removal of quotas will shift the demand curve inward for domestically-produced cbthes because foreign-produced goods are substitutesfor domestically-produced goods Both the equilibrium price and quantity will fall as foreign clothes are traded in a free market environment. b.an increase in the income of U.S.citizens When income rises,expenditures on normal goods such as cbthing increase, causing the demand curve to shift out.The equilibrium quantity and price will increase c.a cut in the indust y's costs of producing domes stic clothes that is passed on to the market in the form of lower clothing prices A cut in an industry's costs will shift the supply curve out.The equilibrium price will fall and quantity will increase.There is a movement along the demand curve. 9.For which of the following goods is a price inerease likely to lead to a substantial income (as well as substitution)effect? a.salt Small incom effect:The amount of incme that isspen on relative ysmall,but since there are e few subs tes for salt. consumer will not readily substitute it. As the price of salt rises,real income wil fall only slightly,thus leading to a small decline in consumption b.housing Large income effect.no substitution effect:The amount of income spent on housing is relatively large for most consumers.If the price of housing were to rise, real income would be reduced substantially,thereby reducing the consumption of all other goods.However,oonsumers swould find it impossible to substitute for housing,in general c.theater tickets
c. If the price of movie tickets increases, the demand for movie tickets will fall. The demand for coffee is unchanged assuming the goods are unrelated. The demand curve for coffee is unchanged. d. If the price of bus travel increases then the demand for bus tickets will fall and the demand for subway tickets will rise, assuming they are substitutes. The demand curve for subway tickets will shift to the right. 8. Which of the following events would cause a movement along the demand curve for U.S.-produced clothing, and which would cause a shift in the demand curve? a. the removal of quotas on the importation of foreign clothes The removal of quotas will shift the demand curve inward for domestically-produced clothes, because foreign-produced goods are substitutes for domestically-produced goods. Both the equilibrium price and quantity will fall as foreign clothes are traded in a free market environment. b. an increase in the income of U.S. citizens When income rises, expenditures on normal goods such as clothing increase, causing the demand curve to shift out. The equilibrium quantity and price will increase. c. a cut in the industry’s costs of producing domestic clothes that is passed on to the market in the form of lower clothing prices A cut in an industry’s costs will shift the supply curve out. The equilibrium price will fall and quantity will increase. There is a movement along the demand curve. 9. For which of the following goods is a price increase likely to lead to a substantial income (as well as substitution) effect? a. salt Small income effect, small substitution effect: The amount of income that is spent on salt is relatively small, but since there are few substitutes for salt, consumers will not readily substitute away from it. As the price of salt rises, real income will fall only slightly, thus leading to a small decline in consumption. b. housing Large income effect, no substitution effect: The amount of income spent on housing is relatively large for most consumers. If the price of housing were to rise, real income would be reduced substantially, thereby reducing the consumption of all other goods. However, consumers would find it impossible to substitute for housing, in general. c. theater tickets
small income effect.large substitution effect:The amount ofincome that is spent on theater tickets is,but away from th theater tickets by choosing other forms of entertainment (e.g.,television and movies).As the price of theater tickets rises.real income will fall only slightly,but the substitution effect can be large enough to reduce consumption by a large amount. d.food reduce real inco e substantially,thereby reducing the onumption of all othe commodities.Although consumers can substitute out of particular foods,they cannot substitute out of food in general. 10.Suppose that the average household in a state consumes 800 gallons of gasoline per year.A 20-cent gasoline tax is introduced,coupled with a $160 nnual tas rebate per household.Will the household be bet e r or worse off under the new program? If the household does not change its consumption of gasoline,it will be unaffected by the tax-rebate program.because in this case the househol pays 0.20*800=$160 in taxes and receives $160 as an annual tax rebate.The two effects would cancel each other out.To the extent that the household reduces its gas eonsumption through substitution.it must be better of The new budget line (price change plus rebate)will pass through the old consumption point of 80 gallons of gasoline,and any now affordable bundle that contains less gasoline must be on a higher indifference curve.The household will not choose any bundle with more gasoline because these bundles are all inside the old budget line,and hence are inferior to the bundle with 800 gallons of gas 11.Which of the following three groups is likely to hav re the ost,and which the east,price-elastie demand for membership in the Association of Business Economists? a.students The major difference among the groups is the level of income.We know that if the consumption of a good constitutes a large percentage of an individual's income. then the demand for the good will be relatively elastic.If we assume that a membership in the Association of Business Economists is likely to be a large that the be for this group. b.junior executives The level of income for junior executives will be larger than that of students. but smaller than that of senior executives.Therefore,the demand for a membership for this group will be less elastic than that of the students but more elastic than that of the seniorexecutives
Small income effect, large substitution effect: The amount of income that is spent on theater tickets is relatively small, but consumers can substitute away from the theater tickets by choosing other forms of entertainment (e.g., television and movies). As the price of theater tickets rises, real income will fall only slightly, but the substitution effect can be large enough to reduce consumption by a large amount. d. food Large income effect, no substitution effect: As with housing, the amount of income spent on food is relatively large for most consumers. Price increases for food will reduce real income substantially, thereby reducing the consumption of all other commodities. Although consumers can substitute out of particular foods, they cannot substitute out of food in general. 10. Suppose that the average household in a state consumes 800 gallons of gasoline per year. A 20-cent gasoline tax is introduced, coupled with a $160 annual tax rebate per household. Will the household be better or worse off under the new program? If the household does not change its consumption of gasoline, it will be unaffected by the tax-rebate program, because in this case the household pays 0.20*800=$160 in taxes and receives $160 as an annual tax rebate. The two effects would cancel each other out. To the extent that the household reduces its gas consumption through substitution, it must be better off. The new budget line (price change plus rebate) will pass through the old consumption point of 800 gallons of gasoline, and any now affordable bundle that contains less gasoline must be on a higher indifference curve. The household will not choose any bundle with more gasoline because these bundles are all inside the old budget line, and hence are inferior to the bundle with 800 gallons of gas. 11. Which of the following three groups is likely to have the most, and which the least, price-elastic demand for membership in the Association of Business Economists? a. students The major difference among the groups is the level of income. We know that if the consumption of a good constitutes a large percentage of an individual’s income, then the demand for the good will be relatively elastic. If we assume that a membership in the Association of Business Economists is likely to be a large expenditure for students, we may conclude that the demand will be relatively elastic for this group. b. junior executives The level of income for junior executives will be larger than that of students, but smaller than that of senior executives. Therefore, the demand for a membership for this group will be less elastic than that of the students but more elastic than that of the senior executives
c.senior executives The high earnings among senor executives will result in a relatively inelastic demand for membership 12.Explain which of the following items in each pair is more price elastic a.The demand for a specific brand of toothpaste and the demand for toothpaste in general. The demand for a specific brand is more elastie since the consumer can easily switch to another brand if the price goes up. b.The demand for gasoline in the short run and the demand for gasoline in the long run. Demand in the bng run is more elastic since consumers have had more time to adjust to the change in price. Explain the difference betw en a positive and a negative network one individual increases in response to the purchase of the good by other consumers.Fads are an example of a positive network externality.For example, each individuals demand for baggy pants increases as more other individuals begin to wear baggy pants.This is also called a bandwagon effect.A negative network externality exists if the quantity demanded of a good by one individual decre es in response to the purchase of the good by other consumers.In thi case the individual prefers to be different from other individuals.As more people adopt a particular style or purchase a particular type of good,this individual will reduce his demand for the good.Goods like designer clthing can have negative network externalities as some people would not want to wear the same clothes that many other people are wearng. 二、EXERCISES An indilts aside a certain amount of his income per month to spend on his two Given the information b illustrate both the price consum tion curve associated with changes in the price of wine,and the demand curve for wine. Price Price Quantity Quantity Budget Wine Book Wine Book S10 S10 S150 S12 $10 S150 S15 s10 4 9 s150 S20 S10 2 11 s150
c. senior executives The high earnings among senior executives will result in a relatively inelastic demand for membership. 12. Explain which of the following items in each pair is more price elastic. a. The demand for a specific brand of toothpaste and the demand for toothpaste in general. The demand for a specific brand is more elastic since the consumer can easily switch to another brand if the price goes up. b. The demand for gasoline in the short run and the demand for gasoline in the long run. Demand in the long run is more elastic since consumers have had more time to adjust to the change in price. 13. Explain the difference between a positive and a negative network externality, and give an example of each. A positive network externality exists if the quantity demanded of a good by one individual increases in response to the purchase of the good by other consumers. Fads are an example of a positive network externality. For example, each individuals demand for baggy pants increases as more other individuals begin to wear baggy pants. This is also called a bandwagon effect. A negative network externality exists if the quantity demanded of a good by one individual decreases in response to the purchase of the good by other consumers. In this case the individual prefers to be different from other individuals. As more people adopt a particular style or purchase a particular type of good, this individual will reduce his demand for the good. Goods like designer clothing can have negative network externalities as some people would not want to wear the same clothes that many other people are wearing. 二、EXERCISES 1. An individual sets aside a certain amount of his income per month to spend on his two hobbies, collecting wine and collecting books. Given the information below, illustrate both the price consumption curve associated with changes in the price of wine, and the demand curve for wine. Price Wine Price Book Quantity Wine Quantity Book Budget $10 $10 7 8 $150 $12 $10 5 9 $150 $15 $10 4 9 $150 $20 $10 2 11 $150
The price consumption curve of the four optimal bundles given i the table above. As the price of wine increases,the budget line will pivot inward and the optimal bundle will change. 2.An individual consumes two goods,clothing and food.Given the information below,illustrate the income consumption curve,and the Engel curves for clothing and food. Price Price Quantity Quantity Income Clothing Food Clothing Food S10 S2 6 20 S100 S10 R 35 S150 S70 11 S200 S10 S2 15 50 S250 The income consumption curve connects each of the four optimal bundles give n in the table above. As the individual's income incre ases the budget line will shift out and the bundle will hange. The Engel curv for each goo illustrate the relationship between the quantity consumed and income (on the vertical axis).Both Engel curves are upward sloping. income consumption curve
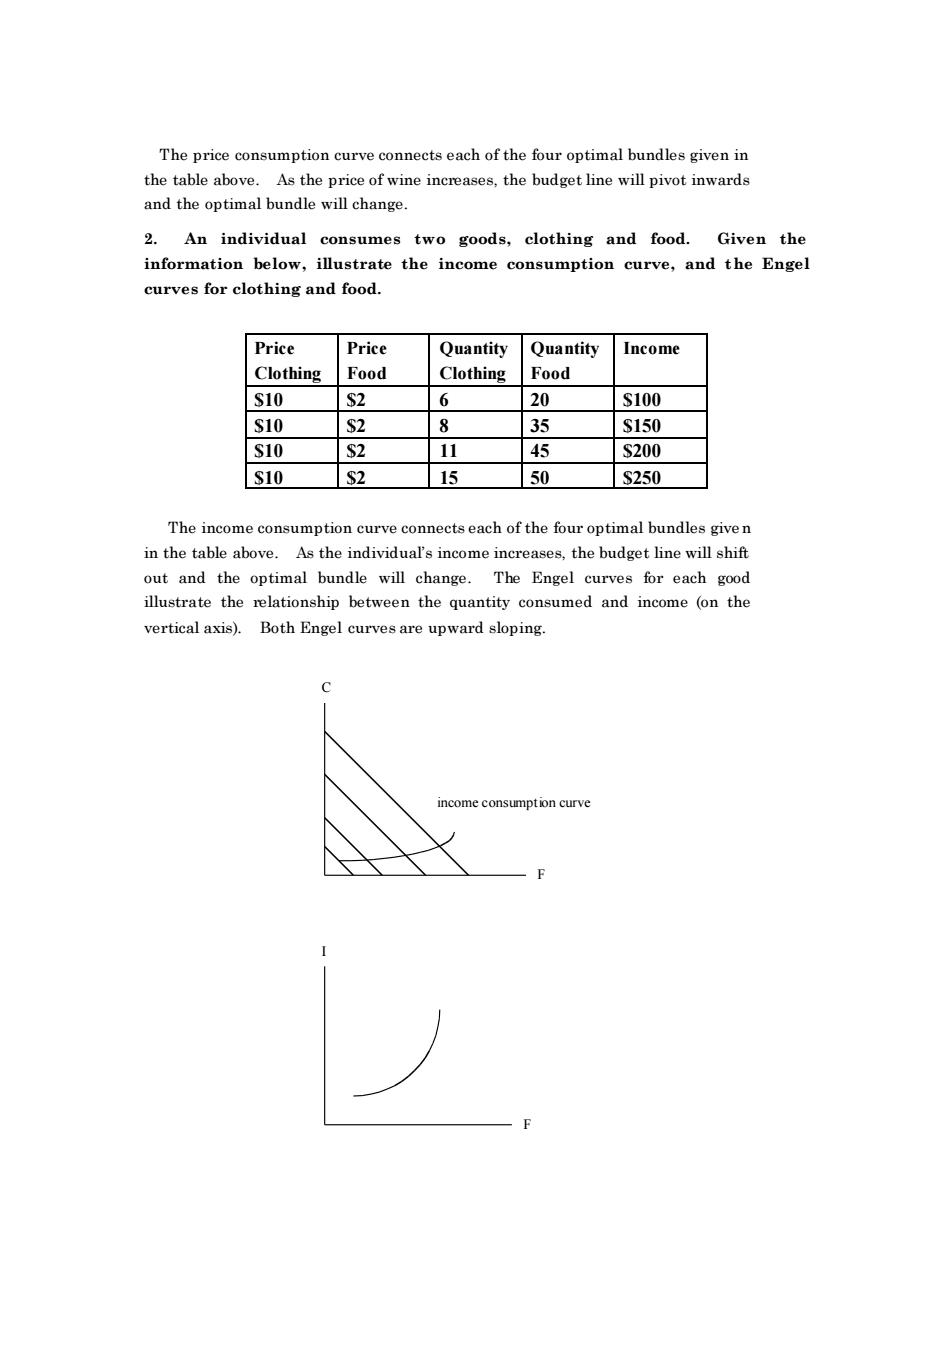
The price consumption curve connects each of the four optimal bundles given in the table above. As the price of wine increases, the budget line will pivot inwards and the optimal bundle will change. 2. An individual consumes two goods, clothing and food. Given the information below, illustrate the income consumption curve, and the Engel curves for clothing and food. Price Clothing Price Food Quantity Clothing Quantity Food Income $10 $2 6 20 $100 $10 $2 8 35 $150 $10 $2 11 45 $200 $10 $2 15 50 $250 The income consumption curve connects each of the four optimal bundles given in the table above. As the individual’s income increases, the budget line will shift out and the optimal bundle will change. The Engel curves for each good illustrate the relationship between the quantity consumed and income (on the vertical axis). Both Engel curves are upward sloping. C F income cons umpt ion curve I F

3.Jane always gets twice as much utility from an extra ballet ticket as she does from an extra basketball ticket,regardless of how many tickets of either type Draw Jane's income consumption curve and her Engel curve for ballet Jane will consume either all ballet tickets or all basketball tickets,depending on the two prices.As long as ballet tickets are less than twice the price of basketball tickets,she will choose all ballet.If ballet tickets are more than twice the price of basketball tickets then she will choose all basketball This can be determined by mparing the marginal utility per dollaror each type of ticket. where her margir another ballet herm rginal another basketball ticket is 1.Her income consumption curve will then lie along the axis of the good that she chooses.As income increases,and the budget line shifts out,she will stick with the chosen good.The Engel curve is a linear. upward-sloping line.For any given increase in income,she will be able to 4.a.Orange juice and apple juice are known to be perfect substitutes.Draw the appropriate price-consumption (for a variable price of orange juice)and income-consumption curves. We know that the indifference curves r perfect substitutes will be straight In this case,the consumer rice of orange juice is less than that of apple juice,the consu purchase only orange juice and the price consumption curve will be on the orange juice axis"of the graph (point F).If apple juice is cheaper,the consumer will purchase only apple juice and the price consumption curve will be on the "apple juice axis"point E).If th two goods have the same price,the consumer will indifferent between the two the pric incide with the indifference curve (between E and F).See the figure below
I C 3. Jane always gets twice as much utility from an extra ballet ticket as she does from an extra basketball ticket, regardless of how many tickets of either type she has. Draw Jane’s income consumption curve and her Engel curve for ballet tickets. Jane will consume either all ballet tickets or all basketball tickets, depending on the two prices. As long as ballet tickets are less than twice the price of basketball tickets, she will choose all ballet. If ballet tickets are more than twice the price of basketball tickets then she will choose all basketball. This can be determined by comparing the marginal utility per dollar for each type of ticket, where her marginal utility of another ballet ticket is 2 and her marginal utility of another basketball ticket is 1. Her income consumption curve will then lie along the axis of the good that she chooses. As income increases, and the budget line shifts out, she will stick with the chosen good. The Engel curve is a linear, upward-sloping line. For any given increase in income, she will be able to purchase a fixed amount of extra tickets. 4. a. Orange juice and apple juice are known to be perfect substitutes. Draw the appropriate price-consumption (for a variable price of orange juice) and income-consumption curves. We know that the indifference curves for perfect substitutes will be straight lines. In this case, the consumer will always purchase the cheaper of the two goods. If the price of orange juice is less than that of apple juice, the consumer will purchase only orange juice and the price consumption curve will be on the “orange juice axis” of the graph (point F). If apple juice is cheaper, the consumer will purchase only apple juice and the price consumption curve will be on the “apple juice axis” (point E). If the two goods have the same price, the consumer will be indifferent between the two; the price consumption curve will coincide with the indifference curve (between E and F). See the figure below

Apple Juice PAPo Orange Juice Assuming that the price of orange juice is less than the price of apple juice,the consumer will maximize her utility by consuming only orange juice.As the levelof income varies only the amount of orange juice varies.Thus,the income consumption curve will be the"orange juice axis"in the figure below. Apple Juice Budget Constraint Income C 03 U Orange Juice 4.b.Left shoes and right shoes are perfect complements.Draw the appropriate price-consumption and income-consumption curves. For goods that are perfect complements,such as right shoes and left shoes,we know that the indifference curves are L-shaped.The point of utility maximization occurs when the budget constraints,L and L touch the kink of U:and U2.See the following figure
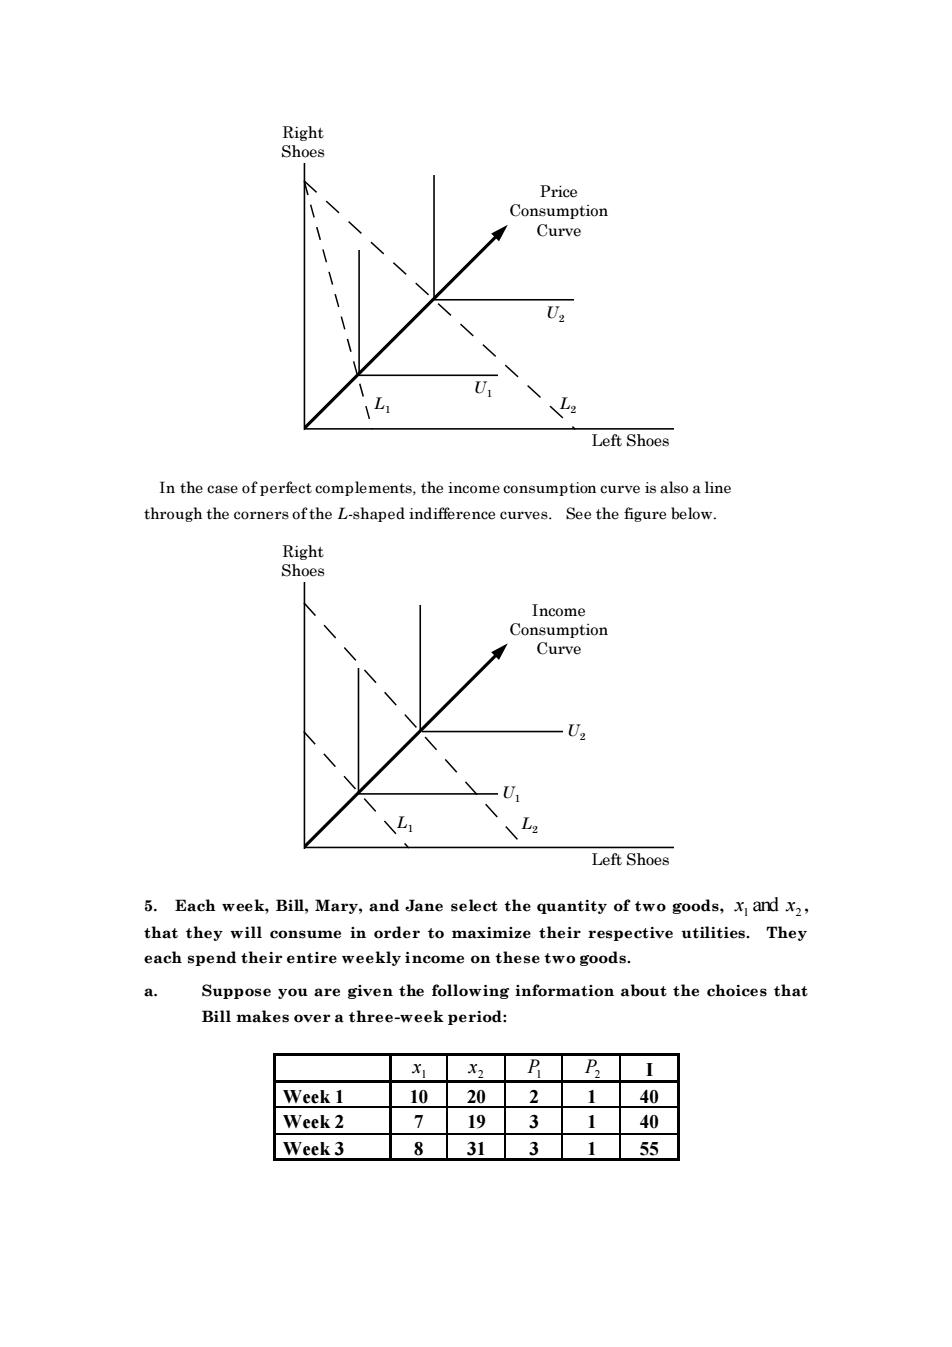
Apple Juice Orange Juice U E F PA = PO PA > PO PA < PO Assuming that the price of orange juice is less than the price of apple juice, the consumer will maximize her utility by consuming only orange juice. As the level of income varies, only the amount of orange juice varies. Thus, the income consumption curve will be the “orange juice axis” in the figure below. Apple Juice Orange Juice U2 U1 U3 Budget Constraint Income Consumption Curve 4.b. Left shoes and right shoes are perfect complements. Draw the appropriate price-consumption and income-consumption curves. For goods that are perfect complements, such as right shoes and left shoes, we know that the indifference curves are L-shaped. The point of utility maximization occurs when the budget constraints, L1 and L2 touch the kink of U1 and U2 . See the following figure
Price Co on Curve U 1 Left Shoes In the case of perfect complements,the income consumption curve is also a line through the corners ofthe L-shaped indifference curves.See the figure below. Right h Incom Con Curve Left Shoes 5.Each week,Bill,Mary,and Jane select the quantity of two goods,x and x, that they will consume in order to maximize their respective utilities They each spend their entire weekly income on these two goods. Suppose you are given the following information about the choices that Bill makes over a three-week period: Week 1 10 40 Week 2 719 40 Week 3 55
Left Shoes U2 U1 Right Shoes L1 L2 Price Consumption Curve In the case of perfect complements, the income consumption curve is also a line through the corners of the L-shaped indifference curves. See the figure below. Left Shoes U2 U1 Right Shoes L1 L2 Income Consumption Curve 5. Each week, Bill, Mary, and Jane select the quantity of two goods, x1 and x2 , that they will consume in order to maximize their respective utilities. They each spend their entire weekly income on these two goods. a. Suppose you are given the following information about the choices that Bill makes over a three-week period: x1 x2 P1 P2 I Week 1 10 20 2 1 40 Week 2 7 19 3 1 40 Week 3 8 31 3 1 55