PARTIV INFORMATION,MARKET FAILURE, AND THE ROLEOF GOVERNMENT CHAPTER 16 GENERAL EQUILIBRIUMAND ECONOMICEFFICIENCY 一、QUESTIONS FOR REVIEW 1.Why can feedback effects make a general equilibrium analysis substantially different from a partial equilibrium analysis? A partial equilibrium analysis focuses on the interaction of supply and demand for one market.It ignores the influences that shifts in supply and demand in one market might have on the markets for complements and substitutes.A general equilibrium analysis takes feedback effects into account,where a price or quantity adjustment in one market can cause a price or quantity adjustment in d markets Ignoring these feedback supply or demand.An initial shift in demand in one market,for exampe, can cause a shift in demand in a related market,which can then cause a second shift in demand in the first market.A partial equilibrium analysis will stop at the first initial shift whereas a generalequilibrium analysis will tinue on and look at possible shifts in demand in relatedm Although analysis should incorporate all feedback effects,one task of the economist is to determine the markets that are most clsely related to the market of primary concern.Attention is directed toward these markets thus enabling better forecasts of changes in equilibrium prices and quantities. 2.In the Edgeworth box diagram explain how one point can simultaneously represent the market baskets owned by two consumers. The Edgeworth box diagram allows us to represent the distribution of two goods between two individuals.The box is formed by inverting the indifference curves of one individual and superimposing these on the indifference curves of another individual.The sides of the box represent axis,we read off the amount to each individual as the difference between the horizontal axis and the point.For one individual,this is the distance from the bottom of the box to the top,and for the other,this is the distance
PART IV INFORMATION, MARKET FAILURE, AND THE ROLE OF GOVERNMENT CHAPTER 16 GENERAL EQUILIBRIUM AND ECONOMIC EFFICIENCY 一、QUESTIONS FOR REVIEW 1. Why can feedback effects make a general equilibrium analysis substantially different from a partial equilibrium analysis? A partial equilibrium analysis focuses on the interaction of supply and demand for one market. It ignores the influences that shifts in supply and demand in one market might have on the markets for complements and substitutes. A general equilibrium analysis takes feedback effects into account, where a price or quantity adjustment in one market can cause a price or quantity adjustment in related markets. Ignoring these feedback effects can lead to inaccurate forecasts of the full effect of changes in either supply or demand. An initial shift in demand in one market, for example, can cause a shift in demand in a related market, which can then cause a second shift in demand in the first market. A partial equilibrium analysis will stop at the first initial shift whereas a general equilibrium analysis will continue on and look at possible shifts in demand in related markets. Although analysis should incorporate all feedback effects, one task of the economist is to determine the markets that are most closely related to the market of primary concern. Attention is directed toward these markets, thus enabling better forecasts of changes in equilibrium prices and quantities. 2. In the Edgeworth box diagram, explain how one point can simultaneously represent the market baskets owned by two consumers. The Edgeworth box diagram allows us to represent the distribution of two goods between two individuals. The box is formed by inverting the indifference curves of one individual and superimposing these on the indifference curves of another individual. The sides of the box represent the total amounts of the two goods available to consumers. On the vertical axis, we read off the amount to each individual as the difference between the horizontal axis and the point. For one individual, this is the distance from the bottom of the box to the top, and for the other, this is the distance
from the top of the box to the bottom.Similarly,the horizontal axis penof eond时dtit加theindivd represents a different allocation of the two goods between the two individuals 3.In the analysis of exchange using the Edgeworth box diagram,explain why both consumers'marginal rates of substitution are equal at every point on the contract curve. The contract curve.in the context of an edgeworth box diagram.is the set of of the two individual tange We know that the marginal 1 rate of substitut to the negative) slope of the indifference curves.Also,when two curves are tangent at a point,their slopes are equal at that point.Thus by defining the contract curve as a set of indifference curve tangencies.the marginal rates of substitution between the two goods are equal for the two individuals given we ass ame convex indifference curves 4. "Since all points on a contract curve are efficient,they are all equally desirable from a social point of view." Do you agree with this statement? Explain. If society is only concerned with efficiency and not with equity.then all points on the contract curve are equally desirable.Since it is impossible to make comparisons of utility between individuals.economics focuses on whether the final allocation is fair),then all points on the contract curve are not equally desirable. 5.How does the utility possibilities frontier relate to the contract curve? Since each point in an Edgeworth box can be compared to every other point by each individual,individuals can assign a preference ordering to all points This preference ordering is the utility function. Wa can (utility)f raph these pref ith lev one individual one ax and levels of satisfaction scond individual on the other axis. course,more than two individuals can be represented with more axes.) The utility-possibility frontier shows the levels of satisfaction achieved by each of two individuals when they have traded to an efficient outcome on the contract While points that lie between the origin utility-possibility theyare not bcause furthe trading will leave one individual better off without making the other individual worse off.Points outside the frontier are not feasible unless the individuals are given greater amounts ofone or both goods. 6.In the Edgeworth production box diagram,what conditions must hold for an allocation to be on the production-contract curve?Why is a competitive equilibrium on th econtract curve?
from the top of the box to the bottom. Similarly, the horizontal axis represents amounts of a second good distributed to the two individuals. Each point in the box represents a different allocation of the two goods between the two individuals. 3. In the analysis of exchange using the Edgeworth box diagram, explain why both consumers’ marginal rates of substitution are equal at every point on the contract curve. The contract curve, in the context of an Edgeworth box diagram, is the set of points where the indifference curves of the two individuals are tangent. We know that the marginal rate of substitution is equal to the (negative) slope of the indifference curves. Also, when two curves are tangent at a point, their slopes are equal at that point. Thus, by defining the contract curve as a set of indifference curve tangencies, the marginal rates of substitution between the two goods are equal for the two individuals given we assume convex indifference curves. 4. “Since all points on a contract curve are efficient, they are all equally desirable from a social point of view.” Do you agree with this statement? Explain. If society is only concerned with efficiency and not with equity, then all points on the contract curve are equally desirable. Since it is impossible to make comparisons of utility between individuals, economics focuses on efficiency. But, if we are also concerned with equity (i.e., whether the final allocation is fair), then all points on the contract curve are not equally desirable. 5. How does the utility possibilities frontier relate to the contract curve? Since each point in an Edgeworth box can be compared to every other point by each individual, individuals can assign a preference ordering to all points. This preference ordering is the utility function. We can graph these preferences with levels of satisfaction (utility) for one individual on one axis and levels of satisfaction for a second individual on the other axis. (Of course, more than two individuals can be represented with more axes.) The utility-possibility frontier shows the levels of satisfaction achieved by each of two individuals when they have traded to an efficient outcome on the contract curve. While points that lie between the origin and the utility-possibility frontier are feasible they are not efficient because further trading will leave one individual better off without making the other individual worse off. Points outside the frontier are not feasible unless the individuals are given greater amounts of one or both goods. 6. In the Edgeworth production box diagram, what conditions must hold for an allocation to be on the production-contract curve? Why is a competitive equilibrium on the contract curve?
When oonstructing an Edgeworth box for the production of two goods with between the two production processes. With production,each point can b ordered according to the total output.These points lie on isoquants instead of on indifference curves.Since each point simultaneously represents the allocation of inputs to two production processes.it lies on two isoquants.one oreach productionp combinations of inputs that are technically efficient Thus,there woul be no way to increase the output of one good without decreasing the output of the other good. a competitive equilibrium is one point on the production-contract curve.it is the intersection of the production-contract curve and a line passing through the initial allocation with a slope equo the ratio ratio f prices dictates the rates at which puts can be traded in the market.)For a competitive equilibrium to hold,each producer must use inputs so that the slopes of the isoquants are equal to one another and also equal to the ratio ofthe prices of the two inputs.Therefore,the competitive equilibrium production.(Thisequilibrium assumesonvex curves.) 7.How is the production-possibilities frontier related to the production contract curve' We can graph the quantities of each good produced (each point in the Edgeworth box)on a two-dimensional graph,where the vertical axis represents the output of one good and the horizontal axis represents the output of the other good.The production-contract curve is represented in this two-dimensional graph as heproductionpoesibilhitiesiont Points inside this frontierare feasible but inefficient Points outside the frontie are infeasible and only attainable when more inputs become available or production processes become more efficient. Points on the production-possibilities fmontier are the same as those on the curve measures inputs on the axes and the production-possibilities frontie measures outputs on the axes. 8.What is the marginal rate of transformation (MRT)?Explain why the MRTof one good for another is equal to the ratio of the marginal costs of producing the two goods. The marginal rate of transformation.MrT is equal to the absolute value of the slope of the production possibilities frontier,and measures how much of t must b he ofall inputs is the me at each point on the production given up to possibilities fronter because we use the same total amount of all inputs, and merely allocate them differently along the fmontier.Therefore.when
When constructing an Edgeworth box for the production of two goods with two inputs, each point in the box represents an allocation of the two inputs between the two production processes. With production, each point can be ordered according to the total output. These points lie on isoquants instead of on indifference curves. Since each point simultaneously represents the allocation of inputs to two production processes, it lies on two isoquants, one for each production process. The production contract curve represents all combinations of inputs that are technically efficient. Thus, there would be no way to increase the output of one good without decreasing the output of the other good. A competitive equilibrium is one point on the production-contract curve. It is the intersection of the production-contract curve and a line passing through the initial allocation with a slope equal to the ratio of prices. (The ratio of prices dictates the rates at which inputs can be traded in the market.) For a competitive equilibrium to hold, each producer must use inputs so that the slopes of the isoquants are equal to one another and also equal to the ratio of the prices of the two inputs. Therefore, the competitive equilibrium is efficient in production. (This equilibrium assumes convex indifference curves.) 7. How is the production-possibilities frontier related to the production contract curve? We can graph the quantities of each good produced (each point in the Edgeworth box) on a two-dimensional graph, where the vertical axis represents the output of one good and the horizontal axis represents the output of the other good. The production-contract curve is represented in this two-dimensional graph as the production possibilities frontier. Points inside this frontier are feasible but inefficient. Points outside the frontier are infeasible and only attainable when more inputs become available or production processes become more efficient. Points on the production-possibilities frontier are the same as those on the production-contract curve. The difference is that the production-contract curve measures inputs on the axes and the production-possibilities frontier measures outputs on the axes. 8. What is the marginal rate of transformation (MRT)? Explain why the MRT of one good for another is equal to the ratio of the marginal costs of producing the two goods. The marginal rate of transformation, MRT, is equal to the absolute value of the slope of the production possibilities frontier, and measures how much of one output must be given up to produce one more unit of the other output. The total cost of all inputs is the same at each point on the production possibilities frontier because we use the same total amount of all inputs, and merely allocate them differently along the frontier. Therefore, when
we move down along the frontier.the cost of producing one output is reduced by thesame Suppose the give up 4 units of the output on the vertical axis to get one more unit o output on the horiantal axis.This means that the total cost of producing the 4 units is the same as the total cost of producing the one unit,or that the marginal cost of the good on the borizontal axis is 4 times the marginal cost ofthe good on the vertical axis 9.Explain why goods will not be distributed efficiently among consumers ifthe MRT is not equal to the consumers'marginal rate of substitution. If the marginal rate of transformation,MRT.is not equal to the marginal rate of substitution,MRS,we ould reallocate inputs in producing output to leave the consumers and producers better off If the MRS is greater than the MRTthen consumers are willing to pay more for another unit of e another unit of the e good. between what consumers are willing to pay and what the producers have to pay to produce the extra unit.Note also that when MRT=MRS.the ratio of marginal cost will not be equal to the ratio of prices.This means that one good is being sold at a price below marg nal cost and one good is being sold at a price above marginal cost.We should increase the outpu of the one good whose price is above marginal cost and reduce the output of the other good whose price is below marginal cost. 10.Why can free trade between two countries make consumers of both countries better off? Free trade between two countries expands each country's effective production,and allows each country to onume at point above its original production possibilities frontier.Assuming each country has a comparative advantage in the production of some good or service,trade allows a country to specialize in the area where it has this advantage.It trades these outputs for those more cheaply produced in another country.onumer in both countries. 11.If Country A has an absolute advantage in the production of both goods compared to Country B,then it is not in Country A's best interest to trade with country B.True or false?Explain. This statement is false.A country can have an absolute advantage in the will still only have a co ction of me goods. 4 units of labor to produce good 1 and 8 units of labor to produce good 2 whereas Country B requires 8 units and 12 units respectively.Country A can produce both goods more cheaply so has an absolute advantage in the
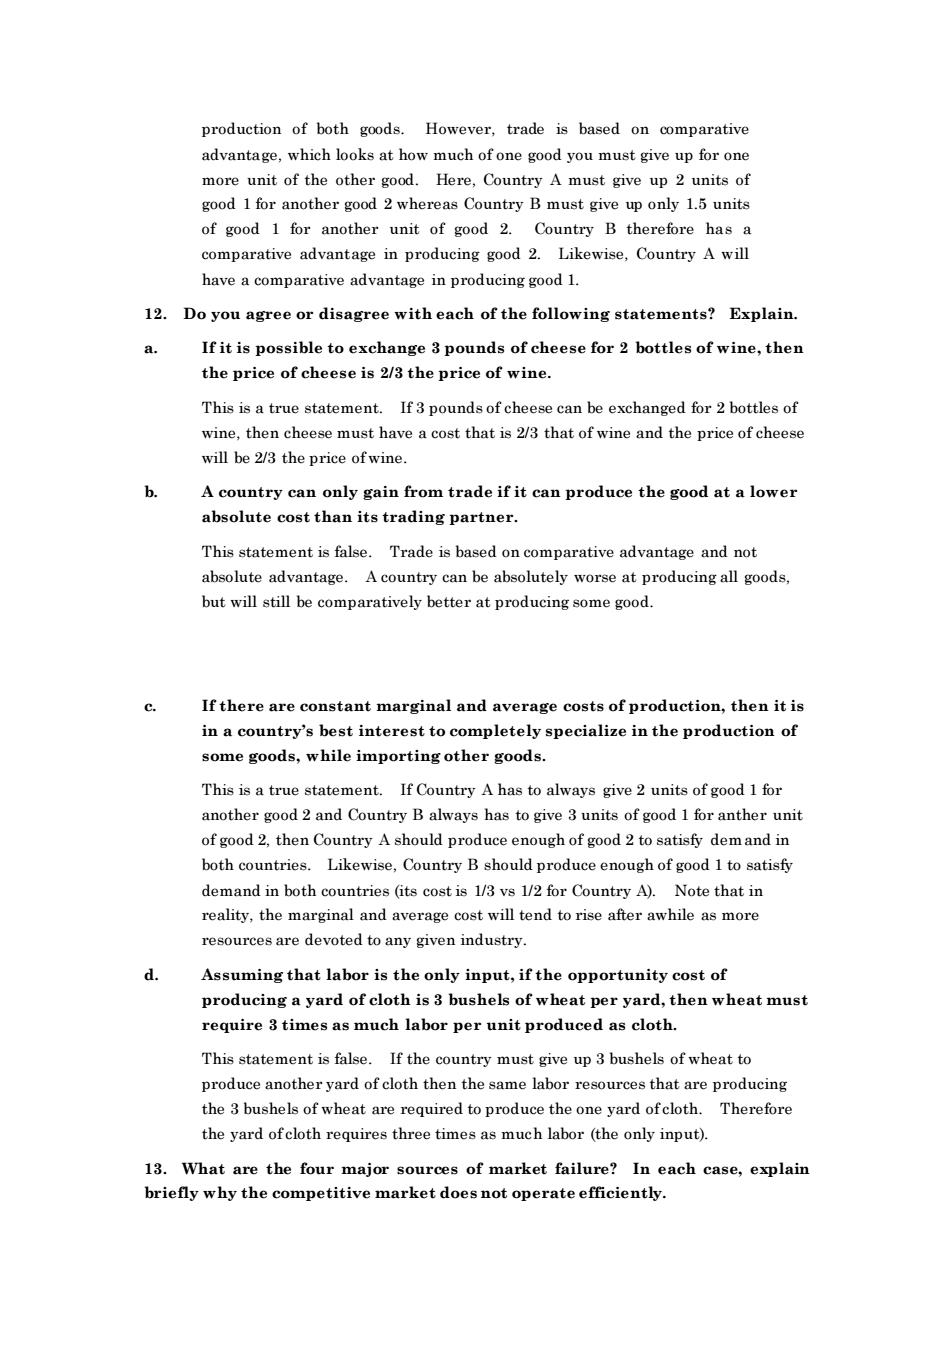
we move down along the frontier, the cost of producing one output is reduced by the same amount that the cost of producing the other output is increased. Suppose the MRT is 4 in absolute value terms, then we must give up 4 units of the output on the vertical axis to get one more unit of output on the horizontal axis. This means that the total cost of producing the 4 units is the same as the total cost of producing the one unit, or that the marginal cost of the good on the horizontal axis is 4 times the marginal cost of the good on the vertical axis. 9. Explain why goods will not be distributed efficiently among consumers if the MRT is not equal to the consumers’ marginal rate of substitution. If the marginal rate of transformation, MRT, is not equal to the marginal rate of substitution, MRS, we could reallocate inputs in producing output to leave the consumers and producers better off. If the MRS is greater than the MRT then consumers are willing to pay more for another unit of a good than it will cost the producers to produce another unit of the good. Both can therefore be made better off by arranging a trade somewhere between what consumers are willing to pay and what the producers have to pay to produce the extra unit. Note also that when MRT MRS, the ratio of marginal cost will not be equal to the ratio of prices. This means that one good is being sold at a price below marginal cost and one good is being sold at a price above marginal cost. We should increase the output of the one good whose price is above marginal cost and reduce the output of the other good whose price is below marginal cost. 10. Why can free trade between two countries make consumers of both countries better off? Free trade between two countries expands each country’s effective production possibilities frontier, and allows each country to consume at a point above its original production possibilities frontier. Assuming each country has a comparative advantage in the production of some good or service, trade allows a country to specialize in the area where it has this advantage. It trades these outputs for those more cheaply produced in another country. Therefore, specialization benefits many consumers in both countries. 11. If Country A has an absolute advantage in the production of both goods compared to Country B, then it is not in Country A’s best interest to trade with country B. True or false? Explain. This statement is false. A country can have an absolute advantage in the production of all goods but they will still only have a comparative advantage in the production of some goods. Suppose Country A requires 4 units of labor to produce good 1 and 8 units of labor to produce good 2, whereas Country B requires 8 units and 12 units respectively. Country A can produce both goods more cheaply so has an absolute advantage in the
production of both goods.However,trade is based on comparative r one more unit of the other good Here,Country A must give up 2 units of good 1 for another good 2 whereas Country B must give up only 1.5 units of good 1 for another unit of good 2.Country B therefore has a comparative advantage in producing good 2.Likewise,Country A will have a comparative advantage in producing good 1. 12. Do you agree or disagree with each of the following statements?Explain If it is possible to of cheese for 2 bottles of wine,then the price of cheese is 2/3 the price of wine This is a true statement.If 3pounds of cheese can be exchanged for 2 bottles of wine,then cheese must have a cost that is 2/3 that of wine and the price of cheese will be 2/3 the price of wine. A country can only gain from trade if it can produce the good at a lower absolute cost than its trading partner. This statement is false.Trade is based on co arative advantage and not ntage y can be abs ely worse at producing all goods but will still be comparatively better at producing some good If there are constant marginal and average costs of production,then it is in a country's best interest to completely specialize in the production of some goods,while importing other goods. This is a true statement.If Country A has to always give 2 units of good 1 for another good 2 and Country B always has to give 3 units of good 1 for anther unit of good2 the Country Ashould produe ugh of good 2t atisfy der mand in both countries Likewise.Country B should produce enough of good 1 to satisfy demand in both countries (its cost is 1/3 vs 1/2 for Country A). Note that in reality,the marginal and average cost will tend to rise after awhile as more resoures are devoted to any given industry. Ass ming that labor is the only input,if the opportunity cost of pro g a yard of c th is3 bushels of whe at per yard,then wheat must require 3 times as much labor per unit produced as cloth This statement is false.If the country must give up3bushels of wheat to produce another yard of cloth then the same labor resources that are producing the 3 bushels of wheat are required to produce the one yard ofcloth.Therefore the vard ofcloth requires three times as much labor (the only input). 13.What are the four major sources of market failure?In each case,explain briefly why the c aket do s not operate e
production of both goods. However, trade is based on comparative advantage, which looks at how much of one good you must give up for one more unit of the other good. Here, Country A must give up 2 units of good 1 for another good 2 whereas Country B must give up only 1.5 units of good 1 for another unit of good 2. Country B therefore has a comparative advantage in producing good 2. Likewise, Country A will have a comparative advantage in producing good 1. 12. Do you agree or disagree with each of the following statements? Explain. a. If it is possible to exchange 3 pounds of cheese for 2 bottles of wine, then the price of cheese is 2/3 the price of wine. This is a true statement. If 3 pounds of cheese can be exchanged for 2 bottles of wine, then cheese must have a cost that is 2/3 that of wine and the price of cheese will be 2/3 the price of wine. b. A country can only gain from trade if it can produce the good at a lower absolute cost than its trading partner. This statement is false. Trade is based on comparative advantage and not absolute advantage. A country can be absolutely worse at producing all goods, but will still be comparatively better at producing some good. c. If there are constant marginal and average costs of production, then it is in a country’s best interest to completely specialize in the production of some goods, while importing other goods. This is a true statement. If Country A has to always give 2 units of good 1 for another good 2 and Country B always has to give 3 units of good 1 for anther unit of good 2, then Country A should produce enough of good 2 to satisfy demand in both countries. Likewise, Country B should produce enough of good 1 to satisfy demand in both countries (its cost is 1/3 vs 1/2 for Country A). Note that in reality, the marginal and average cost will tend to rise after awhile as more resources are devoted to any given industry. d. Assuming that labor is the only input, if the opportunity cost of producing a yard of cloth is 3 bushels of wheat per yard, then wheat must require 3 times as much labor per unit produced as cloth. This statement is false. If the country must give up 3 bushels of wheat to produce another yard of cloth then the same labor resources that are producing the 3 bushels of wheat are required to produce the one yard of cloth. Therefore the yard of cloth requires three times as much labor (the only input). 13. What are the four major sources of market failure? In each case, explain briefly why the competitive market does not operate efficiently

The four major sources of market failure are market power,incomplete information,externalities and public d We know from the study of market structures that market power le not equal marginal cost. In these situations,the producer is pmducing to little.Consumers could be made better off by redirecting inputs into the production of the good produced under a competitive market structure. thereby lowering price until price is equal to marginal cost Incomplele production or the change in utility from changes in consumption. Eithe too much or too little (at the extreme,none)is produced and consumed. Externalities occur when a consumption or production activity influences other oonsumption of production activities.and these effects are not reflected in market prices Public tha can be cons umed at prices below marginal st (at the extreme,freely)because consumers cannot be excluded.In these four cases,prices do not send the proper signals to either producers or consumers to increase or decrease production or consumption.Thus.the market mechanism cannot equate social marginal costs with social marginal benefits 二、EXERCISES 1.Suppose gold (G)and silver (S)are substitutes for each other because both ges against ealso t suppli of bo rixed in the short run o75,and 300).and that the demands for gold an Suppo tt证 ar silver are given by the following equations: P6=975-QG+0.5Ps and Pg=600-Qg+0.5PG What are the equilibrium prices of gold and silver? In the short run,the quantity of gold,is fixed at 75.Substitute into the demand equation for gold: Pc=975.75+0.5P In the short run,the quantity of silver.Os,is fixed at 300.Substituting Q into the demand equation for silver: Ps=600-300+0.5PG Since we now have two equations and two unknowns,substitute the price of gold into the price ofsilver demand function and solve for the price ofsilver: Ps=600.300+(0.5900+0.5Ps)=$1,000 Now substitute the price of silver into the demand for gold function Pc=975.75+(0.501,000)=$1,400 Suppose a new discovery of gold doubles the quantity supplied to 150. How will this discovery affect the prices of both gold and silver?
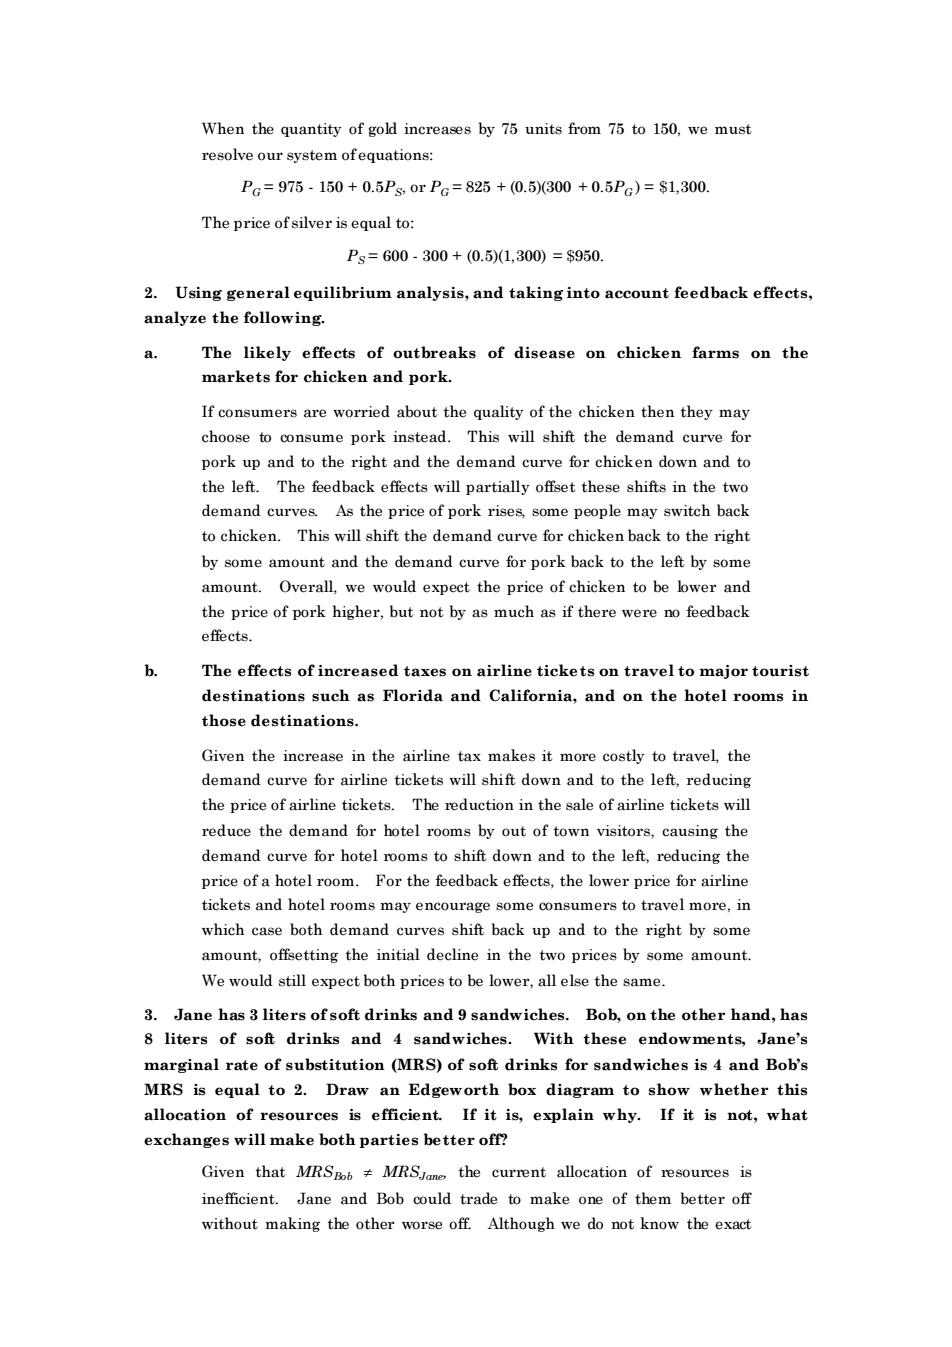
The four major sources of market failure are market power, incomplete information, externalities, and public goods. We know from the study of market structures that market power leads to situations where price does not equal marginal cost. In these situations, the producer is producing too little. Consumers could be made better off by redirecting inputs into the production of the good produced under a competitive market structure, thereby lowering price until price is equal to marginal cost. Incomplete information implies that prices do not reflect either the marginal cost of production or the change in utility from changes in consumption. Either too much or too little (at the extreme, none) is produced and consumed. Externalities occur when a consumption or production activity influences other consumption of production activities, and these effects are not reflected in market prices. Public goods are goods that can be consumed at prices below marginal cost (at the extreme, freely) because consumers cannot be excluded. In these four cases, prices do not send the proper signals to either producers or consumers to increase or decrease production or consumption. Thus, the market mechanism cannot equate social marginal costs with social marginal benefits. 二、EXERCISES 1. Suppose gold (G) and silver (S) are substitutes for each other because both serve as hedges against inflation. Suppose also that the supplies of both are fixed in the short run (QG = 75, and QS = 300), and that the demands for gold and silver are given by the following equations: PG = 975 - QG + 0.5PS and PS = 600 - QS + 0.5PG. a. What are the equilibrium prices of gold and silver? In the short run, the quantity of gold, QG, is fixed at 75. Substitute QG into the demand equation for gold: PG = 975 - 75 + 0.5PS. In the short run, the quantity of silver, QS, is fixed at 300. Substituting QS into the demand equation for silver: PS = 600 - 300 + 0.5PG. Since we now have two equations and two unknowns, substitute the price of gold into the price of silver demand function and solve for the price of silver: PS = 600 - 300 + (0.5)(900 + 0.5PS ) = $1,000. Now substitute the price of silver into the demand for gold function: PG = 975 - 75 + (0.5)(1,000) = $1,400. b. Suppose a new discovery of gold doubles the quantity supplied to 150. How will this discovery affect the prices of both gold and silver?
When the quantity of gold increases by 75 units from 75 to 150,we must resolve our system ofequations: P=975-150+0.5Ps0rP=825+0.5300+0.5P)=$1,300. The price of silver is equal to Ps=600300+(0.51,300)=$950. 2.Using general equilibrium analysis,and taking into account feedback effects, analyze the following. a. The likely effects of outbreaks of disease on chicken farms on the markets for chicken and pork. If consumers are worried about the quality of the chicken then they may choose to consume pork instead.This will shift the demand curve for C86eina1 demand c rchic血D如1 The feedback effects will partially offset these shifts in the t demand curves As the price of pork rises,some people may switch back to chicken.This will shift the demand curve for chicken back to the right by some amount and the demand curve for pork back to the left by some amount.Overall,we would expect the price of chicken to be wer and the effects The effects of increased taxes on airline tickets on travel to major tourist destinations such as Florida and California,and on the hotel rooms in those destinations Given the increase in the airline tax makes it more costly to travel the demand curve for airline tickets will shift down and to the left.reducing the price of airline tickets.The reduction in the sale of airline tickets will reduce the demand for hotel rooms by out of town visitors,causing the demand curve for hotel rooms to shift down and to the left.reducing the price of a hotel room.For the feedback effects.the lower price for airline tiekets and hotel rooms mav encourage some consumers to travel more in which case both demand cu ves shift back up and to the right by some amount,the initial decline in the two We would still expect both prices to be lower,all else the same. 3.Jane has 3 liters ofsoft drinks and 9 sandwiches.Bob,on the other hand,has 8 liters of soft drinks and 4 sandwiches.With these endowments,Jane's marginal rate of substitution (MRS)of soft drinks for sandwiches is 4 and Bob's MRS is equal to 2.Draw an Edgeworth box diagram to show whether this allocation resources is efficient. If it is,explain why.If it is not,what exchanges will make both parties better off? Given that MRS MRS the current allocation of resources is inefficient.Jane and Bob could trade to make one of them better off without making the other worse off.Although we do not know the exact
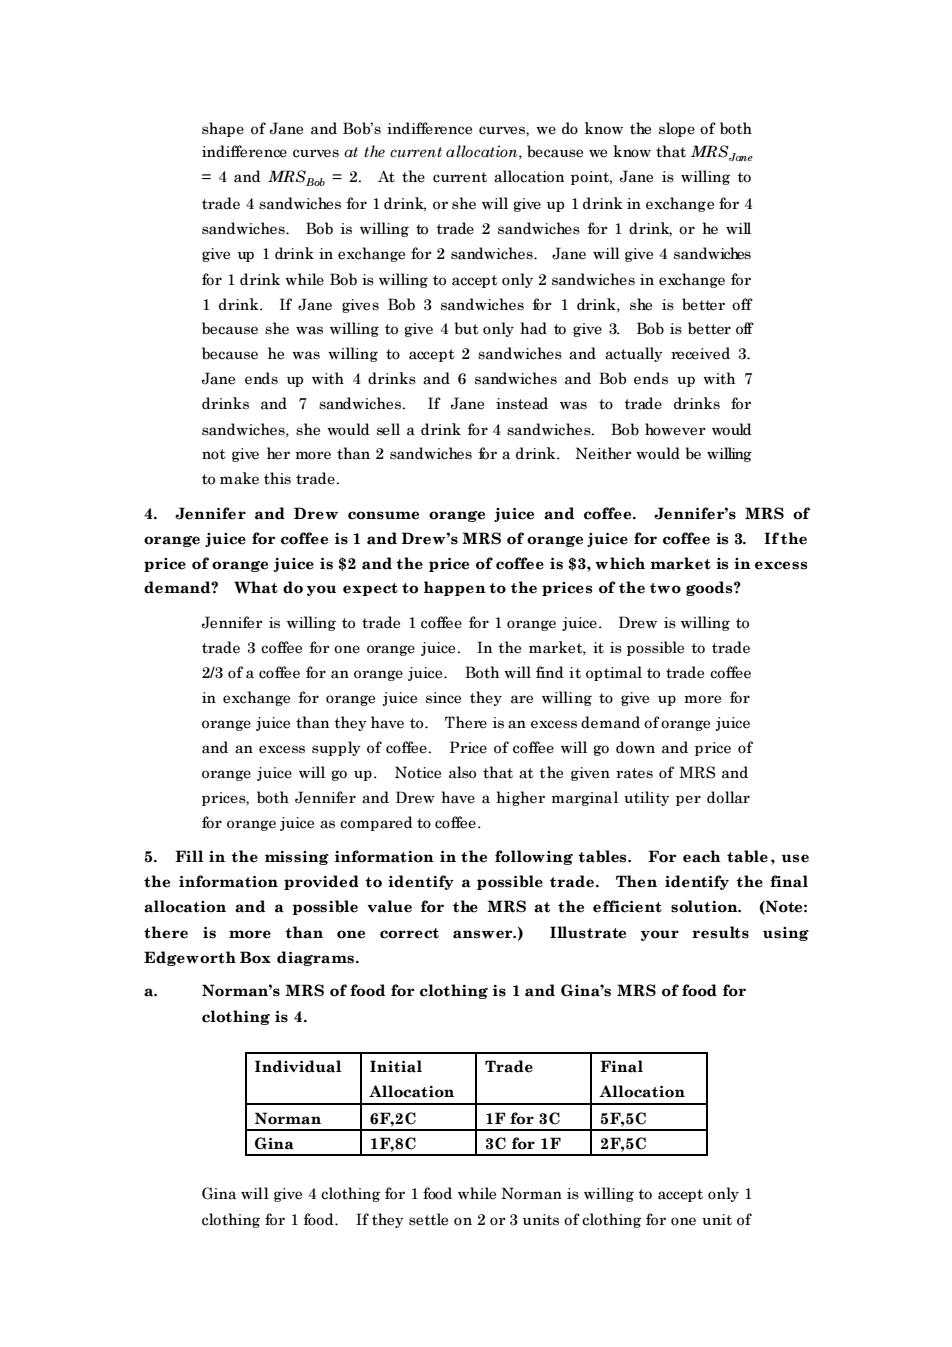
When the quantity of gold increases by 75 units from 75 to 150, we must resolve our system of equations: PG = 975 - 150 + 0.5PS, or PG = 825 + (0.5)(300 + 0.5PG ) = $1,300. The price of silver is equal to: PS = 600 - 300 + (0.5)(1,300) = $950. 2. Using general equilibrium analysis, and taking into account feedback effects, analyze the following. a. The likely effects of outbreaks of disease on chicken farms on the markets for chicken and pork. If consumers are worried about the quality of the chicken then they may choose to consume pork instead. This will shift the demand curve for pork up and to the right and the demand curve for chicken down and to the left. The feedback effects will partially offset these shifts in the two demand curves. As the price of pork rises, some people may switch back to chicken. This will shift the demand curve for chicken back to the right by some amount and the demand curve for pork back to the left by some amount. Overall, we would expect the price of chicken to be lower and the price of pork higher, but not by as much as if there were no feedback effects. b. The effects of increased taxes on airline tickets on travel to major tourist destinations such as Florida and California, and on the hotel rooms in those destinations. Given the increase in the airline tax makes it more costly to travel, the demand curve for airline tickets will shift down and to the left, reducing the price of airline tickets. The reduction in the sale of airline tickets will reduce the demand for hotel rooms by out of town visitors, causing the demand curve for hotel rooms to shift down and to the left, reducing the price of a hotel room. For the feedback effects, the lower price for airline tickets and hotel rooms may encourage some consumers to travel more, in which case both demand curves shift back up and to the right by some amount, offsetting the initial decline in the two prices by some amount. We would still expect both prices to be lower, all else the same. 3. Jane has 3 liters of soft drinks and 9 sandwiches. Bob, on the other hand, has 8 liters of soft drinks and 4 sandwiches. With these endowments, Jane’s marginal rate of substitution (MRS) of soft drinks for sandwiches is 4 and Bob’s MRS is equal to 2. Draw an Edgeworth box diagram to show whether this allocation of resources is efficient. If it is, explain why. If it is not, what exchanges will make both parties better off? Given that MRSBob MRSJane, the current allocation of resources is inefficient. Jane and Bob could trade to make one of them better off without making the other worse off. Although we do not know the exact
shape of Jane and Bob's indifference curves,we do know the slope of both indifference curves at the current allocation,because we know that MRS =4 and MRS=2.At the current allocation point.Jane is willing to trade 4 sandwiches for Idrink,or she will give up 1drink in exchange for 4 sandwiches.Bob is willing to trade 2 sandwiches for 1 drink.or he will give up 1 drink in exchange for 2 sandwiches.Jane will give 4 sandwiches for 1 drink while Bob is willing to accept only 2 sandwiches in exchange for 1 drink. 1 drink, she is bette because she was willing to give 4 buton had togive3.Bob is betterof because he was willing to accept 2 sandwiches and actually received 3 Jane ends up with 4 drinks and 6 sandwiches and Bob ends up with 7 drinks and 7 sandwiches.If Jane instead was to trade drinks for sandwiches,she would sel a sandwiches Bob bow not give her more than 2 sandwiches or a drink ver would Neither would be willing to make this trade 4.Jennifer and Drew consume orange juice and coffee.Jennifer's MRS of orange juice for coffee is 1 and Drew's MRS of orange juice for coffee is 3.Ifthe price of orange iuice is s2 and the price of coffee is $3.which market is in excess demand?What do you expect to happen to the prices of the two goods? Jennifer is willing to trade 1cofee for 1orange juice.Drew is willing to trade 3coffee for one orange juice.In the market,it is possible to trad 2/3 of a coffee for an orange juice.Both will find it optimal to trade coffee in exchange for orange juice since they are willing to give up more for orange juice than they have to.There is an excess demand oforange juice and an excess supply of coffee.Price of coffee will go down and p rice of orange jui will go up. Notice also that at the e given rat of MRS prices,both Jennifer and Drew have a higher marginal utility per dollar for orange juice as compared to coffee. 5.Fill in the missing information in the following tables.For each table,use the information provided to identify a possible trade.Then identify the final allocation and a possible value for the MRS at the efficient solution.(Note: there is more than one correct answer.) Illustrate your results using Edgeworth Box diagrams Norman's MRS of food for clothing is 1 and Gina's MRS of food for clothing is 4. Individual Initial Trade Final Allo Allocatior Norman 6F,2C 1F for 3C 5F,5C Gina 1F.8C 3C for 1F 2F,5C Gina will give 4 clothing for 1 food while No man is willing to accept only 1 clothing for 1 food. If they settle on2or3 units of clothing for one unit of
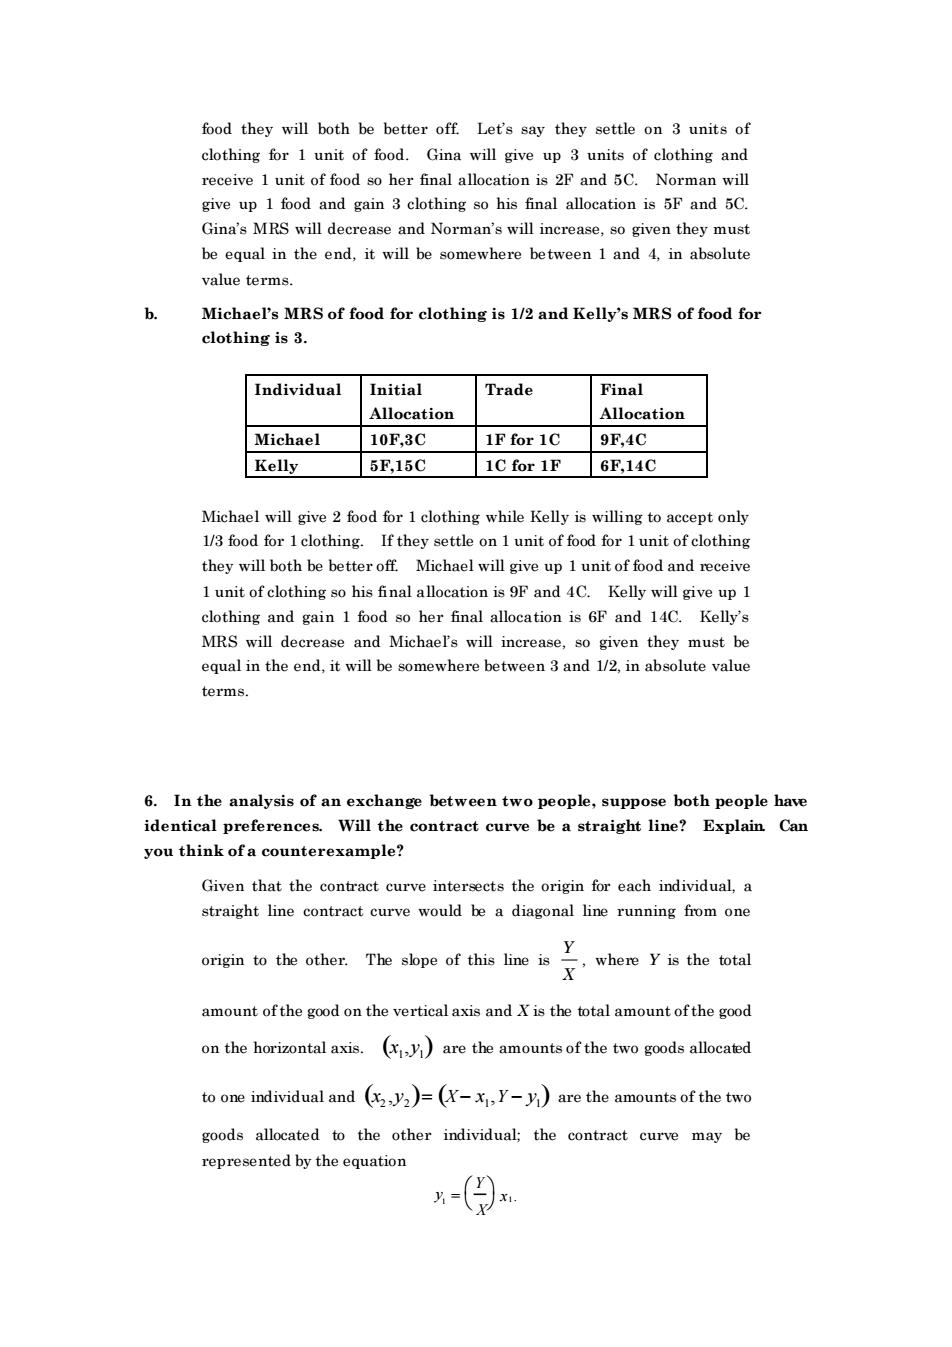
shape of Jane and Bob’s indifference curves, we do know the slope of both indifference curves at the current allocation, because we know that MRSJane = 4 and MRSBob = 2. At the current allocation point, Jane is willing to trade 4 sandwiches for 1 drink, or she will give up 1 drink in exchange for 4 sandwiches. Bob is willing to trade 2 sandwiches for 1 drink, or he will give up 1 drink in exchange for 2 sandwiches. Jane will give 4 sandwiches for 1 drink while Bob is willing to accept only 2 sandwiches in exchange for 1 drink. If Jane gives Bob 3 sandwiches for 1 drink, she is better off because she was willing to give 4 but only had to give 3. Bob is better off because he was willing to accept 2 sandwiches and actually received 3. Jane ends up with 4 drinks and 6 sandwiches and Bob ends up with 7 drinks and 7 sandwiches. If Jane instead was to trade drinks for sandwiches, she would sell a drink for 4 sandwiches. Bob however would not give her more than 2 sandwiches for a drink. Neither would be willing to make this trade. 4. Jennifer and Drew consume orange juice and coffee. Jennifer’s MRS of orange juice for coffee is 1 and Drew’s MRS of orange juice for coffee is 3. If the price of orange juice is $2 and the price of coffee is $3, which market is in excess demand? What do you expect to happen to the prices of the two goods? Jennifer is willing to trade 1 coffee for 1 orange juice. Drew is willing to trade 3 coffee for one orange juice. In the market, it is possible to trade 2/3 of a coffee for an orange juice. Both will find it optimal to trade coffee in exchange for orange juice since they are willing to give up more for orange juice than they have to. There is an excess demand of orange juice and an excess supply of coffee. Price of coffee will go down and price of orange juice will go up. Notice also that at the given rates of MRS and prices, both Jennifer and Drew have a higher marginal utility per dollar for orange juice as compared to coffee. 5. Fill in the missing information in the following tables. For each table , use the information provided to identify a possible trade. Then identify the final allocation and a possible value for the MRS at the efficient solution. (Note: there is more than one correct answer.) Illustrate your results using Edgeworth Box diagrams. a. Norman’s MRS of food for clothing is 1 and Gina’s MRS of food for clothing is 4. Individual Initial Allocation Trade Final Allocation Norman 6F,2C 1F for 3C 5F,5C Gina 1F,8C 3C for 1F 2F,5C Gina will give 4 clothing for 1 food while Norman is willing to accept only 1 clothing for 1 food. If they settle on 2 or 3 units of clothing for one unit of
food they will both be better off Let's say they settle on 3 units of clothingfor 1 unit of food.Gina will give s of clothing and receive unit of food so her final allocation is 2F and 5C.Norman wil give up 1 food and gain 3 clothing so his final allocation is 5F and 5C Gina's MRS will decrease and Norman's will increase.so given they must be equal in the end.it will be somewhere between 1 and 4.in absolute value terms Michael's MRS of food for clothing is 1/2 and Kelly's MRS of food for clothing is 3 Individual Initial Trade Final Allocation Allocation Michael 10F,3C 1F for 1C 9F,4C Kelly 5F,15C 1C for 1F 6F.14C Michael will give 2 food for 1 clothing while kelly is willing to accept onlv 1/3 food for 1clothing.If they settle on 1 unit of food for 1unit of clothing they will both be bet er off. Michael will give up1unit of fod and eceiv 1 unit of clothing so his final allocation is 9F and 4C.Kelly will give up I clothing and gain 1 food so her final allocation is 6F and 14C.Kelly's MRS will decrease and Michael's will increase,so given they must be egual in the end.it will be somewhere between 3 and 1/2 in absolute value terms. 6.In the analysis of an exchange between two people,suppose both people have identical preferences.Will the contract curve be a straight line?Explain Can you think of a counte rexample? Given that the contract curve intersects the origin for each individual,a straight line contract curve would be a diagonal line running from one origin to the other.The bpe of ths iewhen th tal amount of the good on the vertical axis andis the total amount ofthe good on the horizontal axis.)are the amounts of the two goods allocated to one individual and )=(Y-x,Y-y)are the amounts of the two goods allocated to the other individual;the contract curve may be represented by the equation -(
food they will both be better off. Let’s say they settle on 3 units of clothing for 1 unit of food. Gina will give up 3 units of clothing and receive 1 unit of food so her final allocation is 2F and 5C. Norman will give up 1 food and gain 3 clothing so his final allocation is 5F and 5C. Gina’s MRS will decrease and Norman’s will increase, so given they must be equal in the end, it will be somewhere between 1 and 4, in absolute value terms. b. Michael’s MRS of food for clothing is 1/2 and Kelly’s MRS of food for clothing is 3. Individual Initial Allocation Trade Final Allocation Michael 10F,3C 1F for 1C 9F,4C Kelly 5F,15C 1C for 1F 6F,14C Michael will give 2 food for 1 clothing while Kelly is willing to accept only 1/3 food for 1 clothing. If they settle on 1 unit of food for 1 unit of clothing they will both be better off. Michael will give up 1 unit of food and receive 1 unit of clothing so his final allocation is 9F and 4C. Kelly will give up 1 clothing and gain 1 food so her final allocation is 6F and 14C. Kelly’s MRS will decrease and Michael’s will increase, so given they must be equal in the end, it will be somewhere between 3 and 1/2, in absolute value terms. 6. In the analysis of an exchange between two people, suppose both people have identical preferences. Will the contract curve be a straight line? Explain. Can you think of a counterexample? Given that the contract curve intersects the origin for each individual, a straight line contract curve would be a diagonal line running from one origin to the other. The slope of this line is Y X , where Y is the total amount of the good on the vertical axis and X is the total amount of the good on the horizontal axis. x1 ,y1 ( ) are the amounts of the two goods allocated to one individual and x2 ,y2 ( )= X − x1 ,Y − y1 ( ) are the amounts of the two goods allocated to the other individual; the contract curve may be represented by the equation 1 y = Y X x1

We need to show that when the marginal rates of substitution for the two individuals are equal (MRS=MRS)the allocation lies on the contract curve For example,consider the utility function =yThen If MRS'equals MRS,then - Is this point on the contract curve?Yes,because =X.x andy2=Y-y1 四-) This means that 专 X -%=r-%义=gc男-(x With this utility funetion we findMRS=MRSand the ontract curve isa straight line.However,if the two traders have identical preferences but different incomes,the contract curve is not a straight line when one good is inferior. 7.Give an example of conditions when the production possibilities frontier might not be concave. The production possibilities frontier is concave if at least one of the production functions exhibits decreasing turn. If both production functions exhibit co nstant retu ,then the productio possibilities frontier is a straight line.If both production functions exhibit increasing returns to scale,then the production function is convex.The following numerical examples can be used to illustrate this concept. Assume that L is the labor input,and X and Y are the two goods.The fir example is the g returns to scale ca the second e ample is th constant returns to scale case,and the third example is the increasing returns to scale case.Note further that it is not necessary that both products have identical production functions
We need to show that when the marginal rates of substitution for the two individuals are equal (MRS1 = MRS2 ), the allocation lies on the contract curve. For example, consider the utility function U = xi yi 2 . Then MRSi = MUx i MUy i = 2xi yi xi 2 = 2yi xi . If MRS1 equals MRS2 , then 2 1 y x1 = 2 2 y x2 . Is this point on the contract curve? Yes, because x2 = X - x1 and y2 = Y - y1 , 2 y1 x1 = 2 Y − y1 X − x1 . This means that y1 X − x ( 1) x1 = Y − y1 , or y1 X − y1 x1 x1 = Y − y1 , and y1 X x1 − y1 = Y − y1 , or y1 X x1 = Y, or y1 = Y X x1 . With this utility function we find MRS1 = MRS2 , and the contract curve is a straight line. However, if the two traders have identical preferences but different incomes, the contract curve is not a straight line when one good is inferior. 7. Give an example of conditions when the production possibilities frontier might not be concave. The production possibilities frontier is concave if at least one of the production functions exhibits decreasing returns to scale. If both production functions exhibit constant returns to scale, then the production possibilities frontier is a straight line. If both production functions exhibit increasing returns to scale, then the production function is convex. The following numerical examples can be used to illustrate this concept. Assume that L is the labor input, and X and Y are the two goods. The first example is the decreasing returns to scale case, the second example is the constant returns to scale case, and the third example is the increasing returns to scale case. Note further that it is not necessary that both products have identical production functions