正在加载图片...
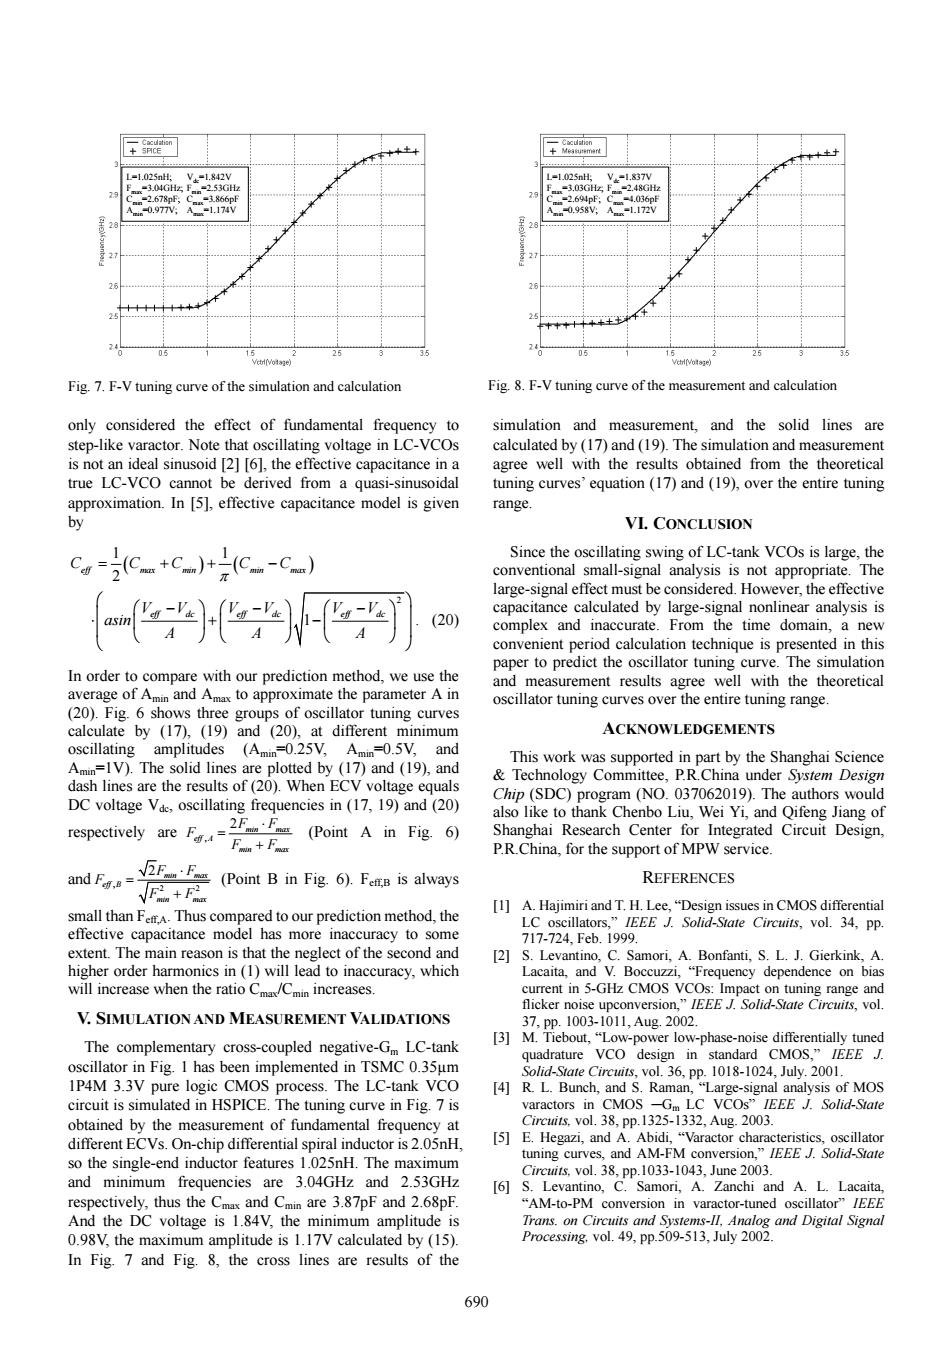
=1025nH V-1.842V V-l.837V -253GH -3.03GH 248GH -2.678pf =主g66 -2.694pF -4.036p .0.977 A-1.174V 0.958: .172V <5 Fig.7.F-V tuning curve of the simulation and calculation Fig.8.F-V tuning curve of the measurement and calculation only considered the effect of fundamental frequency to simulation and measurement.and the solid lines are step-like varactor.Note that oscillating voltage in LC-VCOs calculated by(17)and(19).The simulation and measurement is not an ideal sinusoid [2][6],the effective capacitance in a agree well with the results obtained from the theoretical true LC-VCO cannot be derived from a quasi-sinusoidal tuning curves'equation(17)and(19),over the entire tuning approximation.In [5],effective capacitance model is given range. y VI.CONCLUSION Cw=2(Cm+C)+-(C-C) Since the oscillating swing of LC-tank VCOs is large,the conventional small-signal analysis is not appropriate.The large-signal effect must be considered.However,the effective capacitance calculated by large-signal nonlinear analysis is (20) complex and inaccurate.From the time domain,a new convenient period calculation technique is presented in this paper to predict the oscillator tuning curve.The simulation In order to compare with our prediction method,we use the and measurement results agree well with the theoretical average of Amin and Amax to approximate the parameter A in oscillator tuning curves over the entire tuning range. (20).Fig.6 shows three groups of oscillator tuning curves calculate by (17),(19)and (20),at different minimum ACKNOWLEDGEMENTS oscillating amplitudes (Amin=0.25V,Amin=0.5V,and This work was supported in part by the Shanghai Science Amin=1V).The solid lines are plotted by (17)and (19),and Technology Committee,P.R.China under System Design dash lines are the results of(20).When ECV voltage equals DC voltage Vde,oscillating frequencies in(17,19)and(20) Chip(SDC)program (NO.037062019).The authors would also like to thank Chenbo Liu,Wei Yi,and Qifeng Jiang of respectively areF(Point A in Fig.6) Shanghai Research Center for Integrated Circuit Design, P.R.China,for the support of MPW service and F.= (Point B in Fig.6).Fes is always REFERENCES [1]A.Hajimiri and T.H.Lee,"Design issues in CMOS differential small than FeA.Thus compared to our prediction method,the effective capacitance model has more inaccuracy to some LC oscillators,"IEEE J.Solid-State Circuits,vol.34,pp. 717-724,Feb.1999. extent.The main reason is that the neglect of the second and [2]S.Levantino,C.Samori,A.Bonfanti,S.L.J.Gierkink,A. higher order harmonics in (1)will lead to inaccuracy,which Lacaita,and V.Boccuzzi,"Frequency dependence on bias will increase when the ratio Cma/Cmin increases. current in 5-GHz CMOS VCOs:Impact on tuning range and flicker noise upconversion,"IEEE J.Solid-State Circuits,vol. V.SIMULATION AND MEASUREMENT VALIDATIONS 37.pp.1003-1011,Aug.2002. The complementary cross-coupled negative-Gm LC-tank [3]M.Tiebout,"Low-power low-phase-noise differentially tuned quadrature VCO design in standard CMOS,"IEEE J. oscillator in Fig.I has been implemented in TSMC 0.35um Solid-State Circuits,vol.36,pp.1018-1024,July.2001. 1P4M 3.3V pure logic CMOS process.The LC-tank VCO [4]R.L.Bunch,and S.Raman,"Large-signal analysis of MOS circuit is simulated in HSPICE.The tuning curve in Fig.7 is varactors in CMOS -Gm LC VCOs"IEEE J.Solid-State obtained by the measurement of fundamental frequency at Circuits,vol.38,pp.1325-1332,Aug.2003. different ECVs.On-chip differential spiral inductor is 2.05nH. [5] E.Hegazi,and A.Abidi,"Varactor characteristics,oscillator so the single-end inductor features 1.025nH.The maximum tuning curves,and AM-FM conversion,"IEEE J.Solid-State and minimum frequencies are 3.04GHz and 2.53GHz Circuits,vol.38,pp.1033-1043,June 2003. [6]S.Levantino,C.Samori,A.Zanchi and A.L.Lacaita respectively,thus the Cmax and Cmin are 3.87pF and 2.68pF. "AM-to-PM conversion in varactor-tuned oscillator"/EEE And the DC voltage is 1.84V,the minimum amplitude is Trans.on Circuits and Systems-II,Analog and Digital Signal 0.98V,the maximum amplitude is 1.17V calculated by (15). Processing.vol.49,pp.509-513,July 2002. In Fig.7 and Fig.8,the cross lines are results of the 690only considered the effect of fundamental frequency to step-like varactor. Note that oscillating voltage in LC-VCOs is not an ideal sinusoid [2] [6], the effective capacitance in a true LC-VCO cannot be derived from a quasi-sinusoidal approximation. In [5], effective capacitance model is given by ( ) ( ) 1 1 2 C CC CC eff max min min max π = ++ − 2 1 VV VV VV eff dc eff dc eff dc asin AA A ⎛ ⎞ ⎛ ⎞⎛ ⎞ ⎛ ⎞ −− − ⎜ ⎟ ⋅ +− ⎜ ⎟⎜ ⎟ ⎜ ⎟ ⎝ ⎠⎝ ⎠ ⎝ ⎠ ⎝ ⎠ . (20) In order to compare with our prediction method, we use the average of Amin and Amax to approximate the parameter A in (20). Fig. 6 shows three groups of oscillator tuning curves calculate by (17), (19) and (20), at different minimum oscillating amplitudes (Amin=0.25V, Amin=0.5V, and Amin=1V). The solid lines are plotted by (17) and (19), and dash lines are the results of (20). When ECV voltage equals DC voltage Vdc, oscillating frequencies in (17, 19) and (20) respectively are , 2 min max eff A min max F F F F F ⋅ = + (Point A in Fig. 6) and , 2 2 2 min max eff B min max F F F F F ⋅ = + (Point B in Fig. 6). Feff,B is always small than Feff,A. Thus compared to our prediction method, the effective capacitance model has more inaccuracy to some extent. The main reason is that the neglect of the second and higher order harmonics in (1) will lead to inaccuracy, which will increase when the ratio Cmax/Cmin increases. V. SIMULATION AND MEASUREMENT VALIDATIONS The complementary cross-coupled negative-Gm LC-tank oscillator in Fig. 1 has been implemented in TSMC 0.35µm 1P4M 3.3V pure logic CMOS process. The LC-tank VCO circuit is simulated in HSPICE. The tuning curve in Fig. 7 is obtained by the measurement of fundamental frequency at different ECVs. On-chip differential spiral inductor is 2.05nH, so the single-end inductor features 1.025nH. The maximum and minimum frequencies are 3.04GHz and 2.53GHz respectively, thus the Cmax and Cmin are 3.87pF and 2.68pF. And the DC voltage is 1.84V, the minimum amplitude is 0.98V, the maximum amplitude is 1.17V calculated by (15). In Fig. 7 and Fig. 8, the cross lines are results of the simulation and measurement, and the solid lines are calculated by (17) and (19). The simulation and measurement agree well with the results obtained from the theoretical tuning curves’ equation (17) and (19), over the entire tuning range. VI. CONCLUSION Since the oscillating swing of LC-tank VCOs is large, the conventional small-signal analysis is not appropriate. The large-signal effect must be considered. However, the effective capacitance calculated by large-signal nonlinear analysis is complex and inaccurate. From the time domain, a new convenient period calculation technique is presented in this paper to predict the oscillator tuning curve. The simulation and measurement results agree well with the theoretical oscillator tuning curves over the entire tuning range. ACKNOWLEDGEMENTS This work was supported in part by the Shanghai Science & Technology Committee, P.R.China under System Design Chip (SDC) program (NO. 037062019). The authors would also like to thank Chenbo Liu, Wei Yi, and Qifeng Jiang of Shanghai Research Center for Integrated Circuit Design, P.R.China, for the support of MPW service. REFERENCES [1] A. Hajimiri and T. H. Lee, “Design issues in CMOS differential LC oscillators,” IEEE J. Solid-State Circuits, vol. 34, pp. 717-724, Feb. 1999. [2] S. Levantino, C. Samori, A. Bonfanti, S. L. J. Gierkink, A. Lacaita, and V. Boccuzzi, “Frequency dependence on bias current in 5-GHz CMOS VCOs: Impact on tuning range and flicker noise upconversion,” IEEE J. Solid-State Circuits, vol. 37, pp. 1003-1011, Aug. 2002. [3] M. Tiebout, “Low-power low-phase-noise differentially tuned quadrature VCO design in standard CMOS,” IEEE J. Solid-State Circuits, vol. 36, pp. 1018-1024, July. 2001. [4] R. L. Bunch, and S. Raman, “Large-signal analysis of MOS varactors in CMOS ─Gm LC VCOs” IEEE J. Solid-State Circuits, vol. 38, pp.1325-1332, Aug. 2003. [5] E. Hegazi, and A. Abidi, “Varactor characteristics, oscillator tuning curves, and AM-FM conversion,” IEEE J. Solid-State Circuits, vol. 38, pp.1033-1043, June 2003. [6] S. Levantino, C. Samori, A. Zanchi and A. L. Lacaita, “AM-to-PM conversion in varactor-tuned oscillator” IEEE Trans. on Circuits and Systems-II, Analog and Digital Signal Processing, vol. 49, pp.509-513, July 2002. L=1.025nH; Vdc=1.837V Fmax=3.03GHz; Fmin=2.48GHz Cmin=2.694pF; Cmax=4.036pF Amin=0.958V; Amax=1.172V Fig. 8. F-V tuning curve of the measurement and calculation L=1.025nH; Vdc=1.842V Fmax=3.04GHz; Fmin=2.53GHz Cmin=2.678pF; Cmax=3.866pF Amin=0.977V; Amax=1.174V Fig. 7. F-V tuning curve of the simulation and calculation 690