正在加载图片...
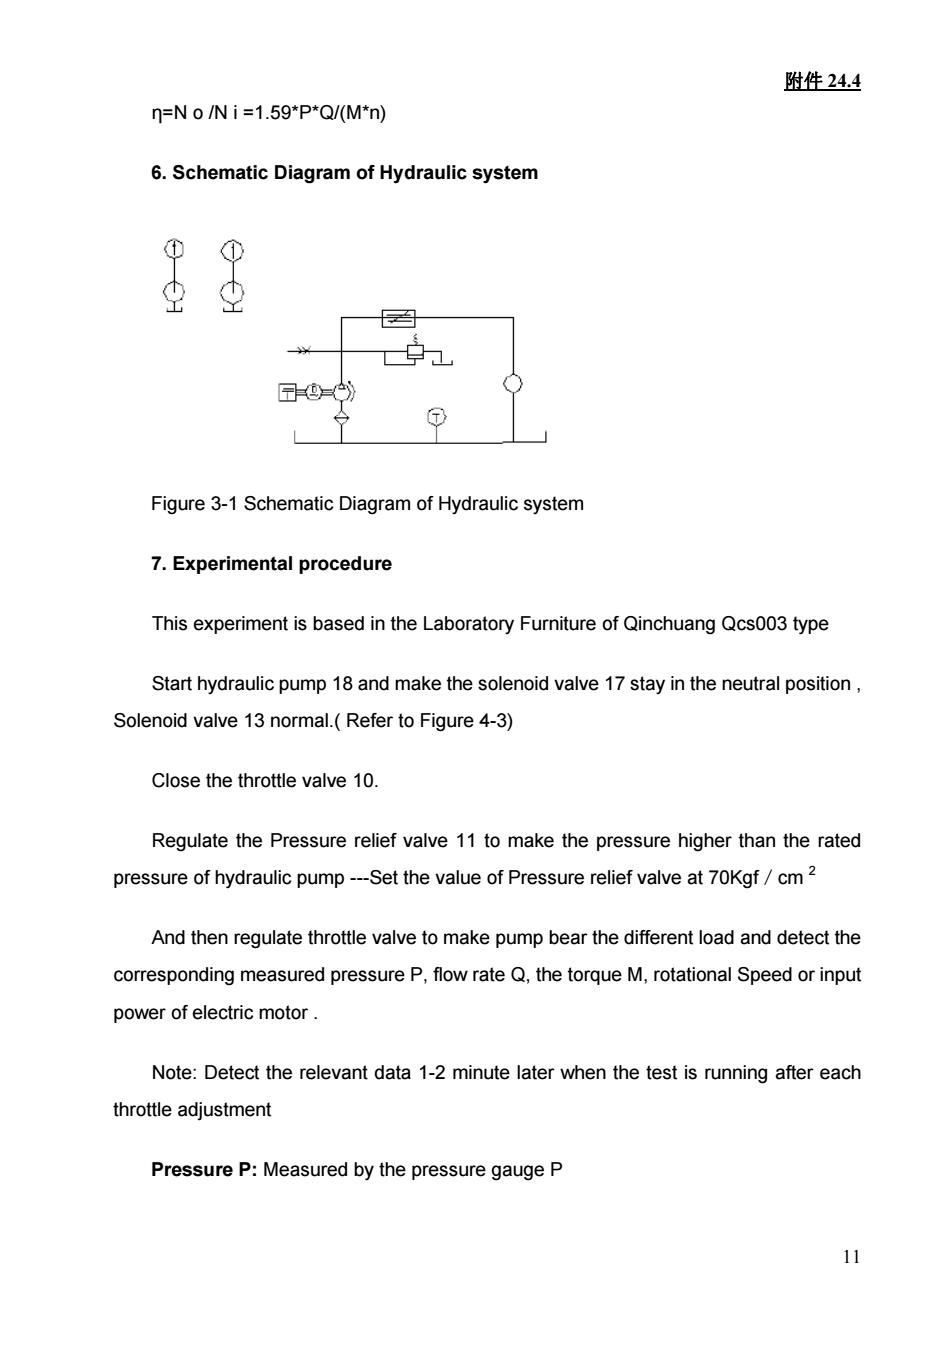
附件24.4 n=N o /N i=1.59*P*Q/(M"n) 6.Schematic Diagram of Hydraulic system 0 ① Figure 3-1 Schematic Diagram of Hydraulic system 7.Experimental procedure This experiment is based in the Laboratory Furniture of Qinchuang Qcs003 type Start hydraulic pump 18 and make the solenoid valve 17 stay in the neutral position, Solenoid valve 13 normal.(Refer to Figure 4-3) Close the throttle valve 10. Regulate the Pressure relief valve 11 to make the pressure higher than the rated pressure of hydraulic pump-Set the value of Pressure relief valve at 70Kgf/cm2 And then regulate throttle valve to make pump bear the different load and detect the corresponding measured pressure P,flow rate Q,the torque M,rotational Speed or input power of electric motor Note:Detect the relevant data 1-2 minute later when the test is running after each throttle adjustment Pressure P:Measured by the pressure gauge P附件 24.4 11 η=N o /N i =1.59*P*Q/(M*n) 6. Schematic Diagram of Hydraulic system Figure 3-1 Schematic Diagram of Hydraulic system 7. Experimental procedure This experiment is based in the Laboratory Furniture of Qinchuang Qcs003 type Start hydraulic pump 18 and make the solenoid valve 17 stay in the neutral position , Solenoid valve 13 normal.( Refer to Figure 4-3) Close the throttle valve 10. Regulate the Pressure relief valve 11 to make the pressure higher than the rated pressure of hydraulic pump -Set the value of Pressure relief valve at 70Kgf/cm 2 And then regulate throttle valve to make pump bear the different load and detect the corresponding measured pressure P, flow rate Q, the torque M, rotational Speed or input power of electric motor . Note: Detect the relevant data 1-2 minute later when the test is running after each throttle adjustment Pressure P: Measured by the pressure gauge P