正在加载图片...
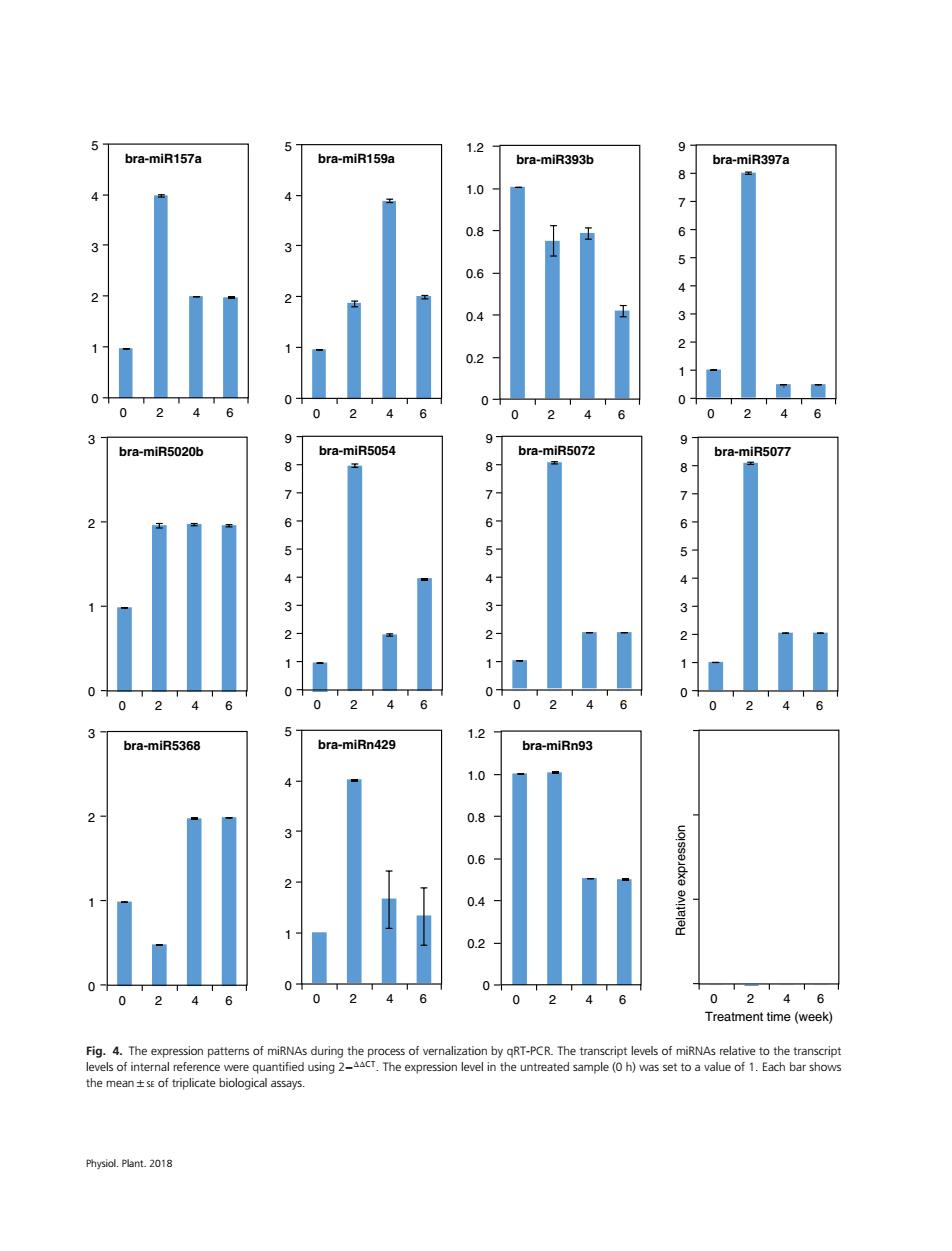
5 1.2 9 bra-miR157a bra-miR159a bra-miR393b bra-miR397a 1.0 0.8 3 3 5 0.6 4 0.4 I 0.2 0 0 2 4 02 4 0 2 4 6 024 9 9 bra-miR5020b bra-miR5054 bra-miR5072 bra-miR5077 8 8 8 7 61 5 4 0 0 024 0 2. 1.2 bra-miR5368 bra-miRn429 bra-miRn93 1.0 41 0.8 0.6 0.4 0.2 0 0 2 4 6 02 46 Treatment time(week) Fig.4.The expression patterns of miRNAs during the process of vernalization by gRT-PCR.The transcript levels of miRNAs relative to the transcript levels of internal reference were quantified using 2-C.The expression level in the untreated sample(0h)was set to a value of 1.Each bar shows the mean +s of triplicate biological assays. Physiol.Plant.20185 4 3 2 1 0 0 2 46 bra-miR157a 5 4 3 2 1 0 0 2 46 bra-miR159a 5 4 3 2 1 0 0 2 46 bra-miR397a 9 8 7 6 3 2 1 0 0 2 46 bra-miR5020b 5 4 3 2 1 0 0 2 46 bra-miR5054 9 8 7 6 5 4 3 2 1 0 0 2 46 bra-miR5072 9 8 7 6 5 4 3 2 1 0 0 2 46 bra-miR5077 9 8 7 6 3 2 1 0 0 2 46 bra-miR5368 5 4 3 2 1 0 0 2 46 bra-miRn429 1.0 0.8 0.6 0.4 0.2 0 0 2 46 bra-miR393b 1.2 1.0 0.8 0.6 0.4 0.2 0 0 2 46 bra-miRn93 1.2 0 2 46 Relative expression Treatment time (week) Fig. 4. The expression patterns of miRNAs during the process of vernalization by qRT-PCR. The transcript levels of miRNAs relative to the transcript levels of internal reference were quantified using 2−ΔΔCT. The expression level in the untreated sample (0 h) was set to a value of 1. Each bar shows the mean±SE of triplicate biological assays. Physiol. Plant. 2018