正在加载图片...
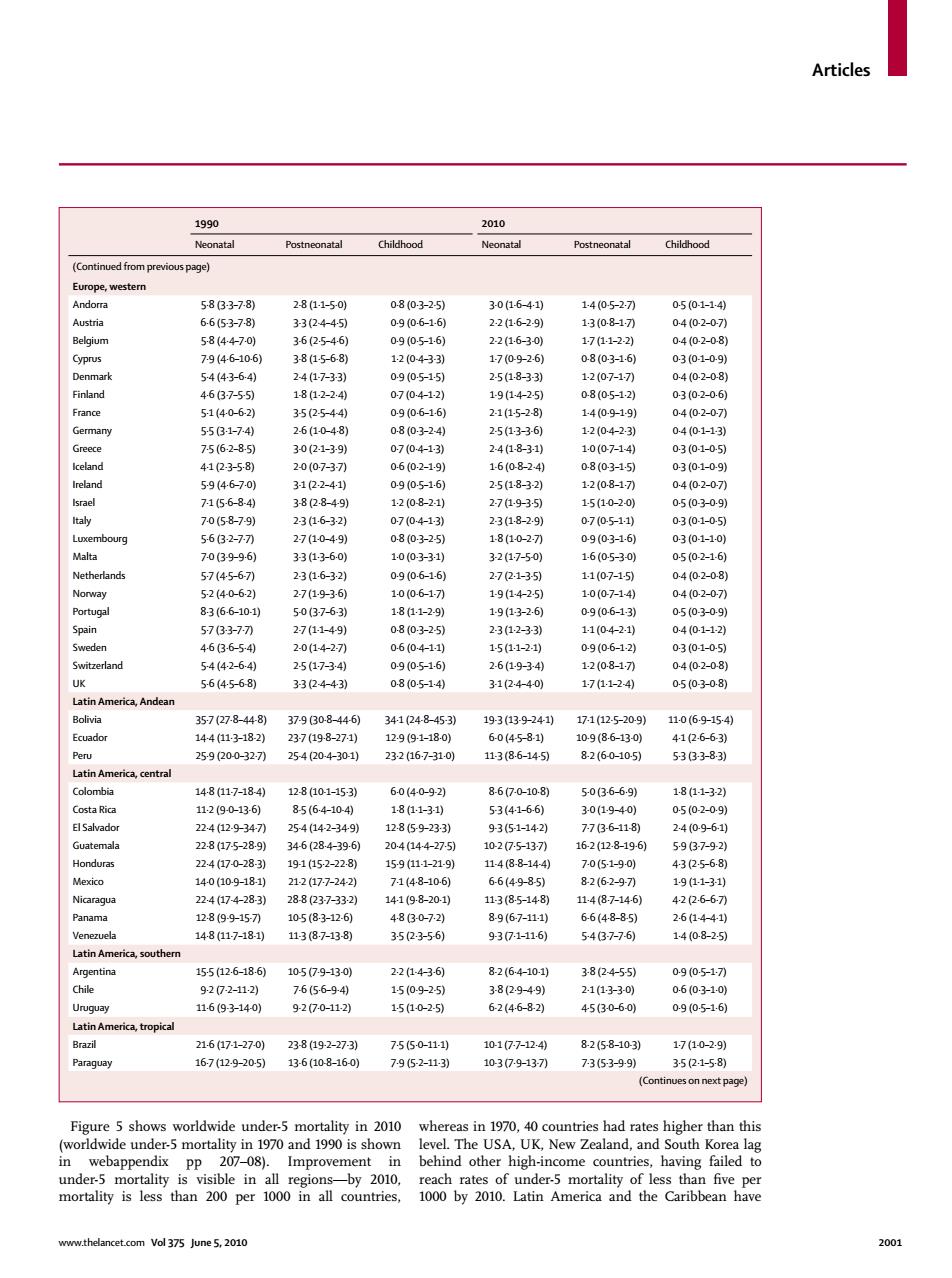
Articles 1990 2010 Neonatal Postneonatal Childhood Neonatal Postneonatal Childhood (Continued from previous page) Europe,western Andorra 5833-78) 2-8(1-1-50) 0-8(0-3-25) 3-0(16-41) 14(0-5-27) 0-5(0-1-14) Austria 6.6(53-7-8) 3-3(24-45) 0-9(0-6-1-6) 2-2(1.6-2-9) 13(08-17刃 0-4(02-07) Belgium 5-8(44-7-0) 3-6(25-4-6) 0-9(0-5-1-6) 2-2(1-6-30) 17(11-2-20 04(0-2-0-8) Cyprus 7-9(4-6-10-6) 3-8(1-5-68) 12(0-4-33) 1-7(09-2-6) 08(0-3-16) 0-3(01-09) Denmark 54(43-64) 2-4(1-7-33) 09(0-5-15) 2-5(1-8-33) 12(0-7-17刃 0-4(0-2-0-8) Finland 4-637-55) 18(1-2-24) 0-7(0-4-1-2) 1-9(14-2-5) 08(0-5-12) 03(0-2-0-6) France 51(4-0-6-2) 35(25-4-4) 0-9(0-6-1-6) 2-1(1-5-2-8) 14(0-9-19) 0-4(0-2-0-7刃 Germany 55(3-1-74) 2-6(1-0-4-8) 0-8(0-3-24) 2-5(13-3-6) 12(04-2-3) 04(01-13) Greece 75(6-2-85) 30(2-1-3-9) 0-7(04-13 2-4(1-8-3-1) 1-0(07-14) 0-3(0-1-0-5) lceland 41(23-5-8) 2-0(07-37) 0-6(02-19) 1-6(08-24) 0-8(03-1) 0-3(01-0-9) Ireland 59(46-7-0) 31(2-2-41) 0-9(0-5-1-6) 2-5(1-8-32) 12(0-8-17刃 04(02-07刀 Israel 7-15-6-84) 3-8(2-8-4-9) 1-2(0-8-21) 2-71-9-35) 1-5(1-0-20) 0-5(0-3-09) Italy 7-0(5-8-79) 23(1-6-3-2) 0-7(04-13) 23(1-8-2-9) 0-7(05-11) 0-3(0-1-0-5) Luxembourg 563-2-7-7刀 27(1-0-49) 0-8(0-3-25) 1-8(1-0-2-7) 0-9(0-3-1-6) 0-3(0-1-1-0) Malta 7-0(3-99-6) 33(13-6-0) 1-0(0-3-31) 3-2(17-50) 1-6(0-5-30) 05(0-2-1-6) Netherlands 57(4567) 23(16-32) 09(0-6-1-6) 27(2-1-35) 11(07-1-5) 04(02-0-8) Norway 52(4-0-6.2) 2-7(19-3-6) 10(0-6-1-7) 1-9(14-25) 1-0(07-14) 0-4(0-2-07) Portugal 8-3(6-6-10-1) 50(37-6-3) 18(1-1-2-9) 19(13-2-6) 09(0-6-13) 05(0-3-0-9) Spain 57(33-7-刃 27(1-1-4-9) 0-8(0-3-25) 2-3(12-33) 1-1(04-2-1) 04(01-1-2) Sweden 4-63-6-540 2-0(1-4-27) 0-6(04-11) 15(11-21) 0-9(0-6-12) 0-3(01-0-5) Switzerland 54(42-6-4) 25(17-34) 0-9(0-5-1-6) 2-6(1-9-3-4) 1-2(0-8-170 0-4(0-2-0-8) UK 5-6(4-5-68) 33(2-4-43) 0-8(05-14) 3-1(24-4-0) 1-7(11-2-4) 05(0-3-08) Latin America,Andean Bolivia 357(27-8-44-8) 37-9(30-8-446) 341(24-8-45-3) 19-3(13-9-24-1) 17-1(12-5-20-9) 11-0(6-9-154) Ecuador 144(11.3-18-2) 23-7(19-8-27-1) 12-9(9-1-18-0) 6-0(4-58-1) 10-9(8.6-13-0) 4-1(2-6-6-3) Peru 25-9(20-0-32-7) 25-4(20-4-301) 23216-7-31.0) 113(8.6-14-5) 8-2(6-0-10-5) 53(33-83) Latin America,central Colombia 14-8(11-7-18-4) 12-8(10-1-153) 6-0(4-0-9-2) 8-6(7-0-108 5-0(36-6-9) 18(11-32) Costa Rica 11-2(9-0-13-6) 85(64-10-4) 1-8(11-3-1) 53(41-6-6) 3-0(1-9-4-0) 0-5(0-2-09) ElSalvador 224(12-9-34-7) 25-4(14-2-349) 12-8(59-233) 93(5-1-142) 7-7(3-6-11-8) 2409-61) Guatemala 228(17-5-28.9) 34-6(28.4-39-6) 204(14-4-27-5) 1027-5-137) 162(12-8-19-6) 59(3-7-92) Honduras 224(17-0-28-3) 19-1(15-2-22-8) 15-9(11-1-21-9) 11-4(8-8-144) 7-0(51-9-0) 43(25-6-8) Mexico 14-0(10-9-181) 21-2(17-7-24-2) 71(48-10-6) 6-6(4-9-8-5) 8-2(6-2-9-7刃 19(1-1-31) Nicaragua 224(17-4-28-3) 28-8(237-332) 14-1(9-8-20-1) 113(8-5-14-8) 114(8-7-14-6) 42(2-6-6-刀 Panama 128(9-9-15-7 105(83-12-6) 4-83-0-7-2) 8-9(67-11-1 6-6(48-85) 2-6(1-4-4-1) Venezuela 14-8(11-7-18-1) 1138.7-13-8) 35(23-5-6) 9-37-1-11-6) 5437-7-6) 14(0-8-2-5) Latin America,southern Argentina 155(12-6-18-6) 1057-9-130) 22(14-3-6) 8-2(6-4-10-1) 38(2-4-55} 09(0517刀 Chile 92(7-2-11.2) 7-6(56-94) 15(0-9-25) 3-8(2.9-4-9) 2-1(13-3-0) 0-6(0-3-1-0) Uruguay 11-6(93-14-0) 9-2(7-0-11-2) 15(1-0-2-5) 6-2(4-6-82) 45(3-0-60) 0-9(0-5-16) Latin America,tropical Brazil 21-6(17-1-27-0) 23-8(192-27-3) 75(5-0-11-1) 10-1(7-7-12-4) 8-2(5-8-103) 1-7(10-2-9) Paraguay 16-7(12-9-20-5) 13-6(10-8-160) 7-9(5-2-113) 1037.9-137) 7-3(53-99) 35(21-5-8) (Continues on next page) Figure 5 shows worldwide under-5 mortality in 2010 whereas in 1970,40 countries had rates higher than this (worldwide under-5 mortality in 1970 and 1990 is shown level.The USA,UK,New Zealand,and South Korea lag in webappendix pp 207-08).Improvement in behind other high-income countries,having failed to under-5 mortality is visible in all regions-by 2010, reach rates of under-5 mortality of less than five per mortality is less than 200 per 1000 in all countries, 1000 by 2010.Latin America and the Caribbean have www.thelancet.com Vol 375 June 5,2010 2001Articles www.thelancet.com Vol 375 June 5, 2010 2001 Figure 5 shows worldwide under-5 mortality in 2010 (worldwide under-5 mortality in 1970 and 1990 is shown in webappendix pp 207–08). Improvement in under-5 mortality is visible in all regions—by 2010, mortality is less than 200 per 1000 in all countries, whereas in 1970, 40 countries had rates higher than this level. The USA, UK, New Zealand, and South Korea lag behind other high-income countries, having failed to reach rates of under-5 mortality of less than fi ve per 1000 by 2010. Latin America and the Caribbean have 1990 2010 Neonatal Postneonatal Childhood Neonatal Postneonatal Childhood (Continued from previous page) Europe, western Andorra 5·8 (3·3–7·8) 2·8 (1·1–5·0) 0·8 (0·3–2·5) 3·0 (1·6–4·1) 1·4 (0·5–2·7) 0·5 (0·1–1·4) Austria 6·6 (5·3–7·8) 3·3 (2·4–4·5) 0·9 (0·6–1·6) 2·2 (1·6–2·9) 1·3 (0·8–1·7) 0·4 (0·2–0·7) Belgium 5·8 (4·4–7·0) 3·6 (2·5–4·6) 0·9 (0·5–1·6) 2·2 (1·6–3·0) 1·7 (1·1–2·2) 0·4 (0·2–0·8) Cyprus 7·9 (4·6–10·6) 3·8 (1·5–6·8) 1·2 (0·4–3·3) 1·7 (0·9–2·6) 0·8 (0·3–1·6) 0·3 (0·1–0·9) Denmark 5·4 (4·3–6·4) 2·4 (1·7–3·3) 0·9 (0·5–1·5) 2·5 (1·8–3·3) 1·2 (0·7–1·7) 0·4 (0·2–0·8) Finland 4·6 (3·7–5·5) 1·8 (1·2–2·4) 0·7 (0·4–1·2) 1·9 (1·4–2·5) 0·8 (0·5–1·2) 0·3 (0·2–0·6) France 5·1 (4·0–6·2) 3·5 (2·5–4·4) 0·9 (0·6–1·6) 2·1 (1·5–2·8) 1·4 (0·9–1·9) 0·4 (0·2–0·7) Germany 5·5 (3·1–7·4) 2·6 (1·0–4·8) 0·8 (0·3–2·4) 2·5 (1·3–3·6) 1·2 (0·4–2·3) 0·4 (0·1–1·3) Greece 7·5 (6·2–8·5) 3·0 (2·1–3·9) 0·7 (0·4–1·3) 2·4 (1·8–3·1) 1·0 (0·7–1·4) 0·3 (0·1–0·5) Iceland 4·1 (2·3–5·8) 2·0 (0·7–3·7) 0·6 (0·2–1·9) 1·6 (0·8–2·4) 0·8 (0·3–1·5) 0·3 (0·1–0·9) Ireland 5·9 (4·6–7·0) 3·1 (2·2–4·1) 0·9 (0·5–1·6) 2·5 (1·8–3·2) 1·2 (0·8–1·7) 0·4 (0·2–0·7) Israel 7·1 (5·6–8·4) 3·8 (2·8–4·9) 1·2 (0·8–2·1) 2·7 (1·9–3·5) 1·5 (1·0–2·0) 0·5 (0·3–0·9) Italy 7·0 (5·8–7·9) 2·3 (1·6–3·2) 0·7 (0·4–1·3) 2·3 (1·8–2·9) 0·7 (0·5–1·1) 0·3 (0·1–0·5) Luxembourg 5·6 (3·2–7·7) 2·7 (1·0–4·9) 0·8 (0·3–2·5) 1·8 (1·0–2·7) 0·9 (0·3–1·6) 0·3 (0·1–1·0) Malta 7·0 (3·9–9·6) 3·3 (1·3–6·0) 1·0 (0·3–3·1) 3·2 (1·7–5·0) 1·6 (0·5–3·0) 0·5 (0·2–1·6) Netherlands 5·7 (4·5–6·7) 2·3 (1·6–3·2) 0·9 (0·6–1·6) 2·7 (2·1–3·5) 1·1 (0·7–1·5) 0·4 (0·2–0·8) Norway 5·2 (4·0–6·2) 2·7 (1·9–3·6) 1·0 (0·6–1·7) 1·9 (1·4–2·5) 1·0 (0·7–1·4) 0·4 (0·2–0·7) Portugal 8·3 (6·6–10·1) 5·0 (3·7–6·3) 1·8 (1·1–2·9) 1·9 (1·3–2·6) 0·9 (0·6–1·3) 0·5 (0·3–0·9) Spain 5·7 (3·3–7·7) 2·7 (1·1–4·9) 0·8 (0·3–2·5) 2·3 (1·2–3·3) 1·1 (0·4–2·1) 0·4 (0·1–1·2) Sweden 4·6 (3·6–5·4) 2·0 (1·4–2·7) 0·6 (0·4–1·1) 1·5 (1·1–2·1) 0·9 (0·6–1·2) 0·3 (0·1–0·5) Switzerland 5·4 (4·2–6·4) 2·5 (1·7–3·4) 0·9 (0·5–1·6) 2·6 (1·9–3·4) 1·2 (0·8–1·7) 0·4 (0·2–0·8) UK 5·6 (4·5–6·8) 3·3 (2·4–4·3) 0·8 (0·5–1·4) 3·1 (2·4–4·0) 1·7 (1·1–2·4) 0·5 (0·3–0·8) Latin America, Andean Bolivia 35·7 (27·8–44·8) 37·9 (30·8–44·6) 34·1 (24·8–45·3) 19·3 (13·9–24·1) 17·1 (12·5–20·9) 11·0 (6·9–15·4) Ecuador 14·4 (11·3–18·2) 23·7 (19·8–27·1) 12·9 (9·1–18·0) 6·0 (4·5–8·1) 10·9 (8·6–13·0) 4·1 (2·6–6·3) Peru 25·9 (20·0–32·7) 25·4 (20·4–30·1) 23·2 (16·7–31·0) 11·3 (8·6–14·5) 8·2 (6·0–10·5) 5·3 (3·3–8·3) Latin America, central Colombia 14·8 (11·7–18·4) 12·8 (10·1–15·3) 6·0 (4·0–9·2) 8·6 (7·0–10·8) 5·0 (3·6–6·9) 1·8 (1·1–3·2) Costa Rica 11·2 (9·0–13·6) 8·5 (6·4–10·4) 1·8 (1·1–3·1) 5·3 (4·1–6·6) 3·0 (1·9–4·0) 0·5 (0·2–0·9) El Salvador 22·4 (12·9–34·7) 25·4 (14·2–34·9) 12·8 (5·9–23·3) 9·3 (5·1–14·2) 7·7 (3·6–11·8) 2·4 (0·9–6·1) Guatemala 22·8 (17·5–28·9) 34·6 (28·4–39·6) 20·4 (14·4–27·5) 10·2 (7·5–13·7) 16·2 (12·8–19·6) 5·9 (3·7–9·2) Honduras 22·4 (17·0–28·3) 19·1 (15·2–22·8) 15·9 (11·1–21·9) 11·4 (8·8–14·4) 7·0 (5·1–9·0) 4·3 (2·5–6·8) Mexico 14·0 (10·9–18·1) 21·2 (17·7–24·2) 7·1 (4·8–10·6) 6·6 (4·9–8·5) 8·2 (6·2–9·7) 1·9 (1·1–3·1) Nicaragua 22·4 (17·4–28·3) 28·8 (23·7–33·2) 14·1 (9·8–20·1) 11·3 (8·5–14·8) 11·4 (8·7–14·6) 4·2 (2·6–6·7) Panama 12·8 (9·9–15·7) 10·5 (8·3–12·6) 4·8 (3·0–7·2) 8·9 (6·7–11·1) 6·6 (4·8–8·5) 2·6 (1·4–4·1) Venezuela 14·8 (11·7–18·1) 11·3 (8·7–13·8) 3·5 (2·3–5·6) 9·3 (7·1–11·6) 5·4 (3·7–7·6) 1·4 (0·8–2·5) Latin America, southern Argentina 15·5 (12·6–18·6) 10·5 (7·9–13·0) 2·2 (1·4–3·6) 8·2 (6·4–10·1) 3·8 (2·4–5·5) 0·9 (0·5–1·7) Chile 9·2 (7·2–11·2) 7·6 (5·6–9·4) 1·5 (0·9–2·5) 3·8 (2·9–4·9) 2·1 (1·3–3·0) 0·6 (0·3–1·0) Uruguay 11·6 (9·3–14·0) 9·2 (7·0–11·2) 1·5 (1·0–2·5) 6·2 (4·6–8·2) 4·5 (3·0–6·0) 0·9 (0·5–1·6) Latin America, tropical Brazil 21·6 (17·1–27·0) 23·8 (19·2–27·3) 7·5 (5·0–11·1) 10·1 (7·7–12·4) 8·2 (5·8–10·3) 1·7 (1·0–2·9) Paraguay 16·7 (12·9–20·5) 13·6 (10·8–16·0) 7·9 (5·2–11·3) 10·3 (7·9–13·7) 7·3 (5·3–9·9) 3·5 (2·1–5·8) (Continues on next page)