正在加载图片...

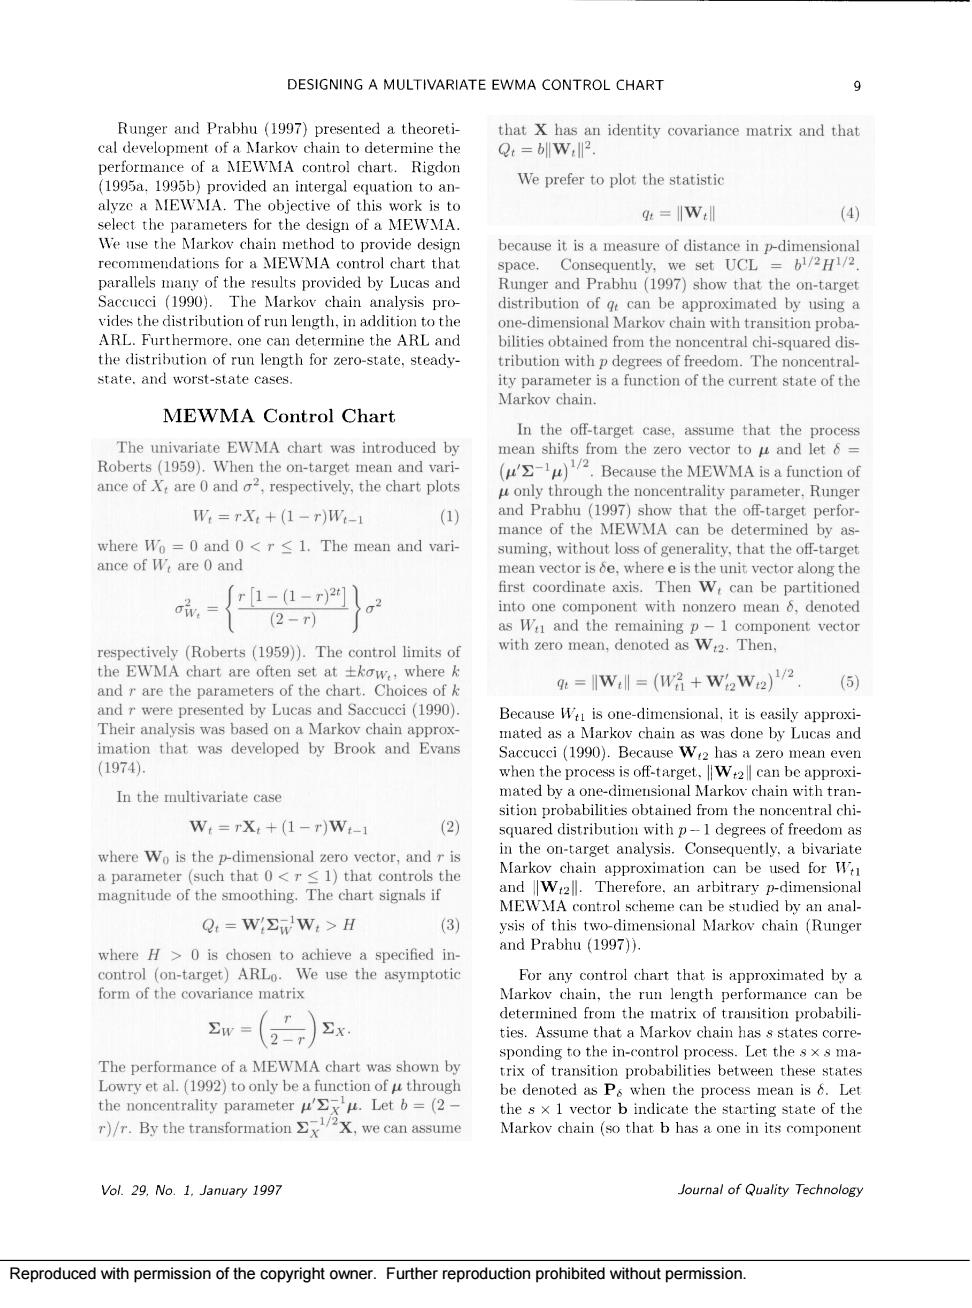
DESIGNING A MULTIVARIATE EWMA CONTROL CHART 9 r and Prabbu(1gg7)p an it We prefer to plot the statistic NEWNA The select the parameters for the design of a MEWMA g=W:ll 4 aa dcabCarttha pace. Saccucci (1990). The Markov chain analysis pro distribution of can be the distribution ofn I-squared di state.and worst-state cases parameter is a function of the current state of the Markecan MEWMA Control Chart The univariate eWMA chart was introduced by Roberts(1959).Whe the MEWMA is a function o only through the noncentrality parameter,Runge W:=rX:+(1-r)W- where Wo =0 and 0<r 1.The mean and vari- rality that the ance of W are 0 and mean vector is e,where e is the unit vector along the first coordinate axis W can be partition (2-T) s and the remainin nent vecto () with zero mean,denoted as W2.Then. and r are the parameters of the chart.Choices of =Iw=(+w2wg)/2 (6) andrwere presented by Lucas and Saccucci(1990) Because wa is one-dimensional,it is easily approxi (1974) zero mean ever In the multivariate case mated by a one-dimeusioual Markoy chain with tran w=rX+(1-r)W- (2) where Wo is the p-dimensional zero vector,and r is he or with p eedom chain approximation can be used for W O,=V∑V,>H 3) n to achieve a specified in- and Prabhu (1997)). ARLWe the opotie ties.Assume that a Markov chain has s states corre- The performance of a MEWMA chart was shown by sponding be denoted as Pwheu the process mean is6.Let )/.By the transformation we can assume Vol.29.No.1.January 1997 Journal of Quality Technology Reproduced with permission of the copyright owner.Further reproduction prohibited without permission. Reproduced with permission of the copyright owner. Further reproduction prohibited without permission