正在加载图片...
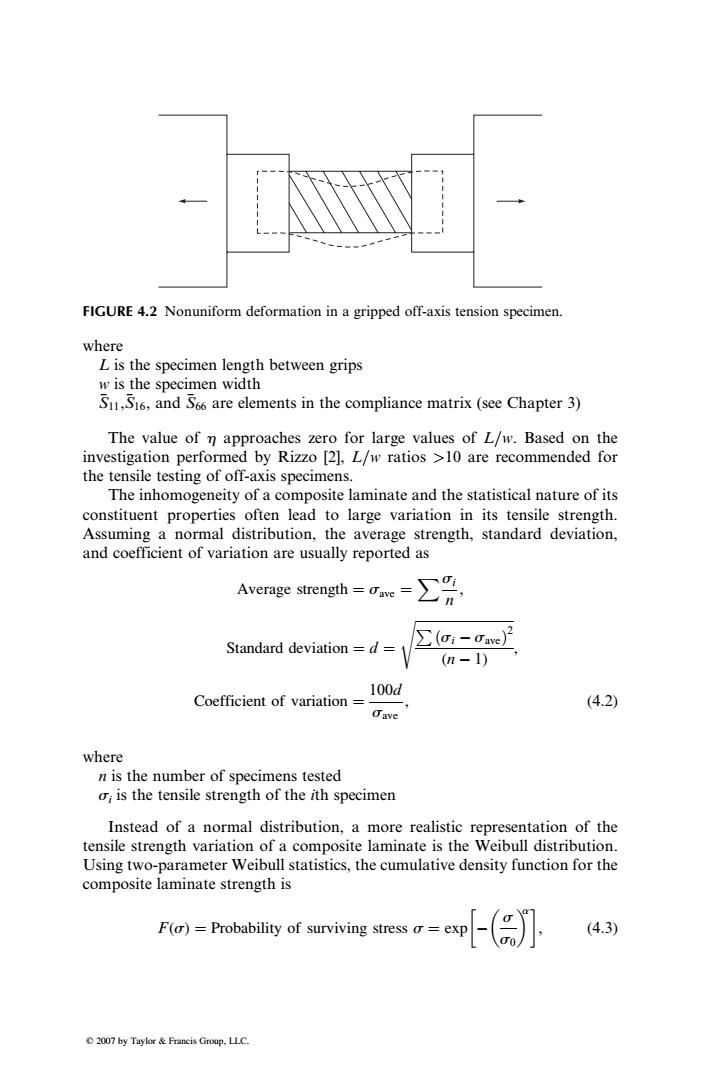
FIGURE 4.2 Nonuniform deformation in a gripped off-axis tension specimen. where L is the specimen length between grips w is the specimen width Su,S16,and S66 are elements in the compliance matrix (see Chapter 3) The value of n approaches zero for large values of L/w.Based on the investigation performed by Rizzo [2],L/w ratios >10 are recommended for the tensile testing of off-axis specimens. The inhomogeneity of a composite laminate and the statistical nature of its constituent properties often lead to large variation in its tensile strength. Assuming a normal distribution,the average strength,standard deviation, and coefficient of variation are usually reported as Average strength Cave= Standard deviation =d= (n-1) 100d Coefficient of variation= (4.2) Jave where n is the number of specimens tested o;is the tensile strength of the ith specimen Instead of a normal distribution,a more realistic representation of the tensile strength variation of a composite laminate is the Weibull distribution. Using two-parameter Weibull statistics,the cumulative density function for the composite laminate strength is F(o)=Probability of surviving stress o=e exp (4.3) 2007 by Taylor&Francis Group.LLC.where L is the specimen length between grips w is the specimen width S11,S16, and S66 are elements in the compliance matrix (see Chapter 3) The value of h approaches zero for large values of L=w. Based on the investigation performed by Rizzo [2], L=w ratios >10 are recommended for the tensile testing of off-axis specimens. The inhomogeneity of a composite laminate and the statistical nature of its constituent properties often lead to large variation in its tensile strength. Assuming a normal distribution, the average strength, standard deviation, and coefficient of variation are usually reported as Average strength ¼ save ¼ Xsi n , Standard deviation ¼ d ¼ Pffiffiffiffiffiffiffiffiffiffiffiffiffiffiffiffiffiffiffiffiffiffiffiffiffiffiffiffiffiffi ð Þ si save 2 (n 1) s , Coefficient of variation ¼ 100d save , (4:2) where n is the number of specimens tested si is the tensile strength of the ith specimen Instead of a normal distribution, a more realistic representation of the tensile strength variation of a composite laminate is the Weibull distribution. Using two-parameter Weibull statistics, the cumulative density function for the composite laminate strength is F(s) ¼ Probability of surviving stress s ¼ exp s s0 a , (4:3) FIGURE 4.2 Nonuniform deformation in a gripped off-axis tension specimen. 2007 by Taylor & Francis Group, LLC.����