正在加载图片...
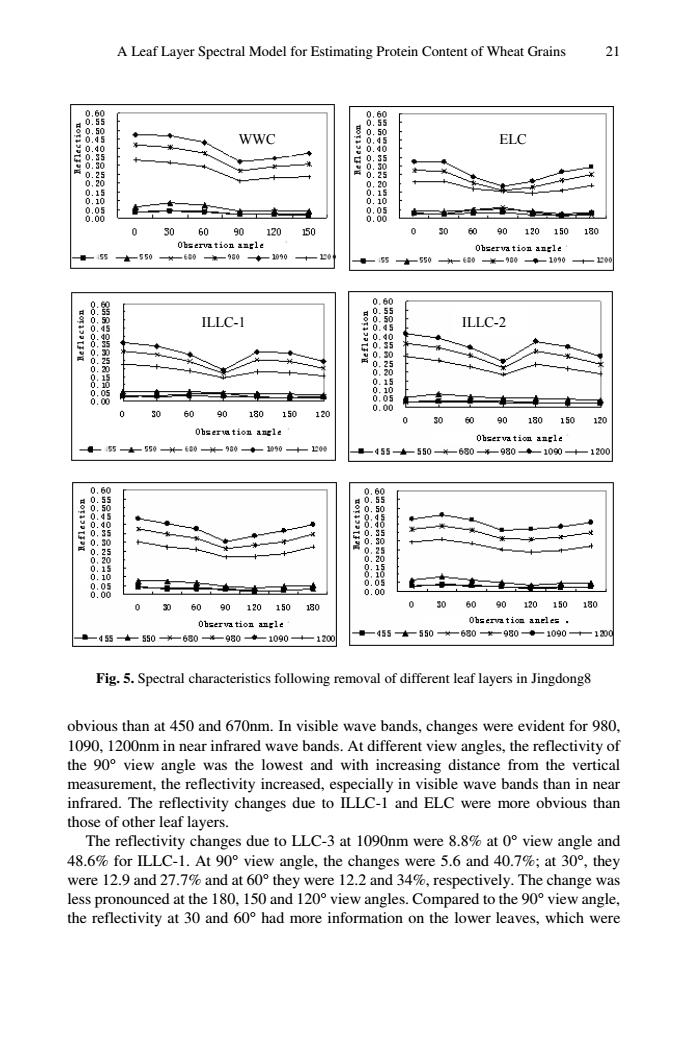
A Leaf Layer Spectral Model for Estimating Protein Content of Wheat Grains 2 WWC ELc 0 30 60 120 50 00 090120150180 -140 ILLC-1 111C2 10 060901801501 455+550+650-980+1090-+1200 0609012015010 050609012010180 45+ 55 20 45550680-980-1090→-10 Fig.5.Spectral characteristics following removal of different leaf layers in Jingdong8 obvious than at 450 and 670nm.In visible wave bands,changes were evident for 980 ed wave bands.At different view angles.the reflectivity o e lowest and with increasing distance from the vertical measurement,the reflectivity increased,especially in visible wave bands than in near infrared.The reflectivity changes due to ILLC-I and ELC were more obvious than those of other leaf layers. The reflectivity changes due to LLC-3 at 1090nm were 8.8%at 0 view angle and 0had more informtion on te o ange wa 150 ew angleA Leaf Layer Spectral Model for Estimating Protein Content of Wheat Grains 21 WWC ELC ILLC-1 ILLC-2 Fig. 5. Spectral characteristics following removal of different leaf layers in Jingdong8 obvious than at 450 and 670nm. In visible wave bands, changes were evident for 980, 1090, 1200nm in near infrared wave bands. At different view angles, the reflectivity of the 90° view angle was the lowest and with increasing distance from the vertical measurement, the reflectivity increased, especially in visible wave bands than in near infrared. The reflectivity changes due to ILLC-1 and ELC were more obvious than those of other leaf layers. The reflectivity changes due to LLC-3 at 1090nm were 8.8% at 0° view angle and 48.6% for ILLC-1. At 90° view angle, the changes were 5.6 and 40.7%; at 30°, they were 12.9 and 27.7% and at 60° they were 12.2 and 34%, respectively. The change was less pronounced at the 180, 150 and 120° view angles. Compared to the 90° view angle, the reflectivity at 30 and 60° had more information on the lower leaves, which were