正在加载图片...
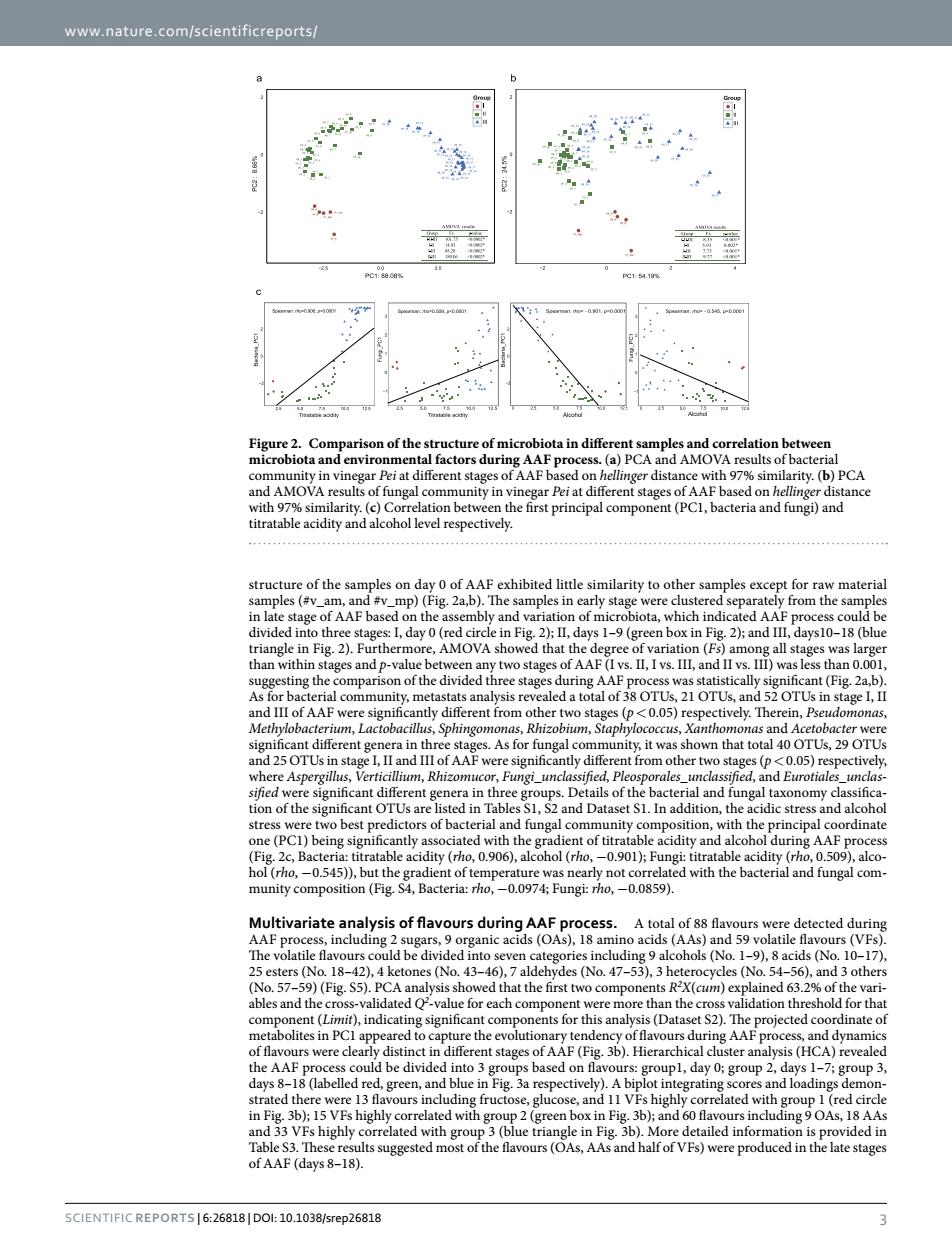
www.nature.com/scientificreports/ nd AMOn rity.(b)PCA rity. ()Corre n bet the first principal component(PCI,bacteria and fungi)and ture of the samples on day 0 of AAF exhibited little similarity to other samples excep raw material and varia (bl AF PROT other ty 0051 The s As for fu nga nity it wa y l an tres 0545),but the acidity ( -0.0859). urs detecteddurie 1-9,8 acids (No.10-1 vsis sh d that the first nts r'x(gm) ined 63. anal t S2).The cted co re clearly distinct in OfAAF(fig,36.Hiera sis (HCA) days(belled red.green.a adings demo OAS.I8 AA of AAF (days 8 SCIENTIFICREPORTS6:26818DOl:10.1038/srep26818www.nature.com/scientificreports/ Scientific Reports | 6:26818 | DOI: 10.1038/srep26818 3 structure of the samples on day 0 of AAF exhibited little similarity to other samples except for raw material samples (#v_am, and #v_mp) (Fig. 2a,b). The samples in early stage were clustered separately from the samples in late stage of AAF based on the assembly and variation of microbiota, which indicated AAF process could be divided into three stages: I, day 0 (red circle in Fig. 2); II, days 1–9 (green box in Fig. 2); and III, days10–18 (blue triangle in Fig. 2). Furthermore, AMOVA showed that the degree of variation (Fs) among all stages was larger than within stages and p-value between any two stages of AAF (I vs. II, I vs. III, and II vs. III) was less than 0.001, suggesting the comparison of the divided three stages during AAF process was statistically significant (Fig. 2a,b). As for bacterial community, metastats analysis revealed a total of 38 OTUs, 21 OTUs, and 52 OTUs in stage I, II and III of AAF were significantly different from other two stages (p< 0.05) respectively. Therein, Pseudomonas, Methylobacterium, Lactobacillus, Sphingomonas, Rhizobium, Staphylococcus, Xanthomonas and Acetobacter were significant different genera in three stages. As for fungal community, it was shown that total 40 OTUs, 29 OTUs and 25 OTUs in stage I, II and III of AAF were significantly different from other two stages (p< 0.05) respectively, where Aspergillus, Verticillium, Rhizomucor, Fungi_unclassified, Pleosporales_unclassified, and Eurotiales_unclassified were significant different genera in three groups. Details of the bacterial and fungal taxonomy classification of the significant OTUs are listed in Tables S1, S2 and Dataset S1. In addition, the acidic stress and alcohol stress were two best predictors of bacterial and fungal community composition, with the principal coordinate one (PC1) being significantly associated with the gradient of titratable acidity and alcohol during AAF process (Fig. 2c, Bacteria: titratable acidity (rho, 0.906), alcohol (rho, −0.901); Fungi: titratable acidity (rho, 0.509), alcohol (rho, −0.545)), but the gradient of temperature was nearly not correlated with the bacterial and fungal community composition (Fig. S4, Bacteria: rho, −0.0974; Fungi: rho, −0.0859). Multivariate analysis of flavours during AAF process. A total of 88 flavours were detected during AAF process, including 2 sugars, 9 organic acids (OAs), 18 amino acids (AAs) and 59 volatile flavours (VFs). The volatile flavours could be divided into seven categories including 9 alcohols (No. 1–9), 8 acids (No. 10–17), 25 esters (No. 18–42), 4 ketones (No. 43–46), 7 aldehydes (No. 47–53), 3 heterocycles (No. 54–56), and 3 others (No. 57–59) (Fig. S5). PCA analysis showed that the first two components R2 X(cum) explained 63.2% of the variables and the cross-validated Q2 -value for each component were more than the cross validation threshold for that component (Limit), indicating significant components for this analysis (Dataset S2). The projected coordinate of metabolites in PC1 appeared to capture the evolutionary tendency of flavours during AAF process, and dynamics of flavours were clearly distinct in different stages of AAF (Fig. 3b). Hierarchical cluster analysis (HCA) revealed the AAF process could be divided into 3 groups based on flavours: group1, day 0; group 2, days 1–7; group 3, days 8–18 (labelled red, green, and blue in Fig. 3a respectively). A biplot integrating scores and loadings demonstrated there were 13 flavours including fructose, glucose, and 11 VFs highly correlated with group 1 (red circle in Fig. 3b); 15 VFs highly correlated with group 2 (green box in Fig. 3b); and 60 flavours including 9 OAs, 18 AAs and 33 VFs highly correlated with group 3 (blue triangle in Fig. 3b). More detailed information is provided in Table S3. These results suggested most of the flavours (OAs, AAs and half of VFs) were produced in the late stages of AAF (days 8–18). Figure 2. Comparison of the structure of microbiota in different samples and correlation between microbiota and environmental factors during AAF process. (a) PCA and AMOVA results of bacterial community in vinegar Pei at different stages of AAF based on hellinger distance with 97% similarity. (b) PCA and AMOVA results of fungal community in vinegar Pei at different stages of AAF based on hellinger distance with 97% similarity. (c) Correlation between the first principal component (PC1, bacteria and fungi) and titratable acidity and alcohol level respectively